Download
1 / 24
240 likes | 376 Views
Unified Modeling Language - Concepts -. Unified Modeling Language. “UML is a language for specifying, visualizing, constructing, and documenting the artifacts of software systems, as well as for business modeling and other non-software systems."

E N D
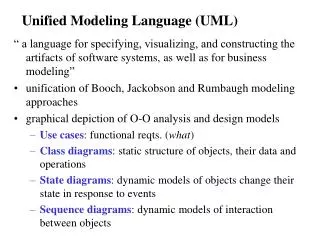
Unified Modeling Language • “UML is a language for specifying, visualizing, constructing, and documenting the artifacts of software systems, as well as for business modeling and other non-software systems." • The Object Management Group adopted UML in 1997 as a standard.
The Need for Unified Modeling Language Every engineering discipline has a standard method of documentation • Electronic engineers have schematic diagrams • Architects have blueprints • Mechanical engineers have blueprints and mechanical diagrams • Software industry has UML
Why use UML? • To professionally design and document software system before any code is written • To easily spot reusable codes • To lower development costs • To identify logical ‘holes’ in design drawings • To reduce ‘re/learning’ of the system • To retrain additional developers effectively. UML Diagrams is an excellent understanding resource • To efficiently communicate with other programmers • To see the bigger picture • To develop more memory and processor efficient codes • To easily make modifications on the system • To ensure fewer surprises – i.e. software will behave as expected • To make the right decisions before any code is written
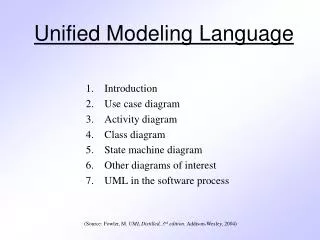
UML Diagrams • Use Case Diagram • Class Diagram • Object Diagram • State Diagram • Sequence Diagram • Collaboration Diagram • Activity Diagram • Component Diagram • Deployment Diagram
Use Case Diagram • Describes what a system does from the standpoint of an external observer. • Use Case Diagram displays the relationship among actors and use cases. • An actor is who or what initiates the events involved in that task. Actors are simply roles that people or objects play. • A use case is a summary of scenarios for a single objective. • The connection betweenactor and use case is a communication association • The emphasis is on what a system does rather than how.
Use Case Diagrams • Source: http://bdn.borland.com
Use Case Diagram • Use case diagrams are helpful in three areas. • determining features (requirements). New use cases often generate new requirements as the system is analyzed and the design takes shape. • communicating with clients. Their notational simplicity makes use case diagrams a good way for developers to communicate with clients. • generating test cases. The collection of scenarios for a use case may suggest a suite of test cases for those scenarios.
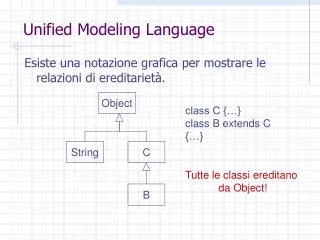
Class Diagram • Things naturally fall into categories (books, trees, computers, …). We refer to these categories as classes • Class Diagram models class structure and contents using design elements such as classes, packages and objects. It also displays relationships such as containment, inheritance, associations and others.
Class Diagram • Source: http://bdn.borland.com
Object Diagram • An object is an instance of a class – a specific thing that has specific values of attributes, and behavior • Object Diagram shows instances instead of classes. They are useful for explaining small pieces with complicated relationships, especially recursive relationships.
Object Diagram • Source: http://bdn.borland.com
State Diagram • At any given time, an object is in a particular state. State diagrams represent these states, and their changes over time. • State Diagram displays the sequences of states that an object of an interaction goes through during its life in response to received stimuli, together with its responses and actions.
State Diagram • Source: http://bdn.borland.com
Sequence Diagram • Class and object diagrams represent static information. In a system objects interact with one another and these interactions occur over time. Sequence diagrams show the time-based dynamics of interaction. • Sequence Diagram displays the time sequence of the objects participating in the interaction. This consists of the vertical dimension (time) and horizontal dimension (different objects).
Sequence Diagram • Source: http://bdn.borland.com
Collaboration Diagram • The elements of a system work together to accomplish the system’s objectives, this is depicted with the collaboration diagram. • Collaboration Diagram displays an interaction organized around the objects and their links to one another. Numbers are used to show the sequence of messages.
Collaboration Diagram • Source: http://bdn.borland.com
Activity Diagram • The activities that occur within a use case or within an object’s behavior typically occur in sequence, which is represented with activity diagrams. • Activity diagram displays a special state diagram where most of the states are action states and most of the transitions are triggered by completion of the actions in the source states. This diagram focuses on flows driven by internal processing.
Activity Diagram • Source: http://bdn.borland.com
Component Diagram • Because large scale system development involves different people working on different components, it’s important to have a diagram to model these. • Component Diagram displays the high level packaged structure of the code itself. Dependencies among components are shown, including source code components, binary code components, and executable components. Some components exist at compile time, at link time, at run times well as at more than one time.
Deployment Diagram • UML provides a standard that enables the system analyst to provide a multi-faceted blueprint that’s comprehensible to clients, programmers and everyone involved in the development process. • Deployment Diagram displays the configuration of run-time processing elements and the software components, processes, and objects that live on them. Software component instances represent run-time manifestations of code units.
Component and Deployment Diagram • Source: http://bdn.borland.com