Download
1 / 36
360 likes | 504 Views
Engineering Bycatch Reduction in West Indian Fish Traps: STFA CRP Trap Vent Study . CRP Project No. NMF4540101. Prior Escape Vent Studies. Escape Vents Tested.

E N D
Engineering Bycatch Reduction in West Indian Fish Traps:STFA CRP Trap Vent Study CRP Project No. NMF4540101
Escape Vents Tested 1 by 16 inch Edge 1 by 53/4inch Vent 1.5 by 5 3/4inch Vent 1 3/4by 5¾ inch Vent 1 3/8 by 93/4 inch Vent 1 3/8 by 5 3/4inch Vent 13/8 by 5 3/4inch Vent
Summary of Trap Hauls * Located top and bottom front and back of the traps.
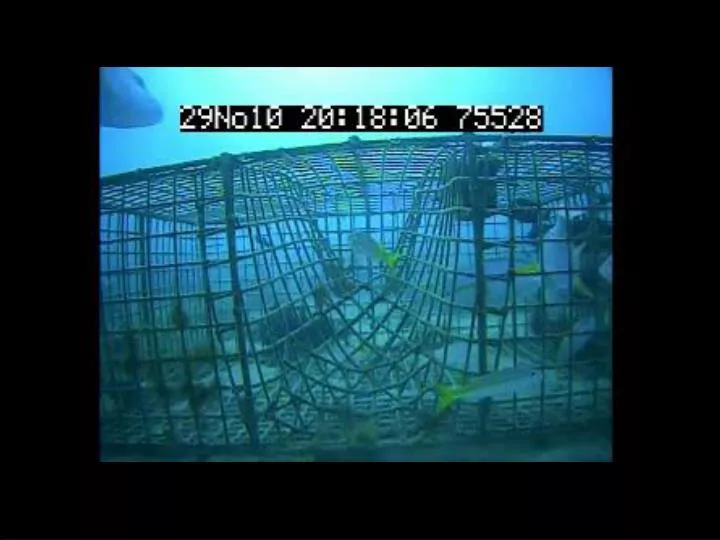
Video Studies • 24 hour videos from 8 days (Renchen, 2010) • Only daylight hours were used in order to be able to identify fish species and positions.* • Position of fish in trap recorded every 5 minutes. • In vent position study, 9 vents were placed in two strings of 10 baited traps. • Vents were closed following final daily observations. • Each trap was observed for 20 minutes and all escapes recorded. • Video was recorded for one trap each day. Renchen reported that peak ingress/egress was around noon and occurred almost entirely during daylight hours.
St. Thomas St. John
Vent Choice Results • A total of 28 escapes were observed or caught on video. • Most escapement involved back vents (74%). • Most escapement involved upper vents (70%). • Results were used to guide design of Phase 4 field testing.
Experimental Design (Diving Studies) • Each trap string inspected by diving (species counts). • Estimate fish required for stocking. • Haul non-experimental traps to collect fish necessary to supplement for stocking. • Haul experimental traps, measure (TL) all fish and examine for fin clips. • Stock traps with fish from experimental and non-experimental traps that have been fin clipped. • Traps set for 1, 3, 5, 7 days before being revisited.
Changes in Numbers During Trap Hauling(Initial Dive vs Initial Haul) % of Trap Hauls
Retention of Fin Clipped Fish in Trap Retention of Fin Clipped Fish in Trap Hauls
Summary • Larger fish were found in in longer sets (p<.06) • 40-80% of the stocked fish left during the first day. Highest escapement was in traps with the widest vents. • For all vent sizes most (90-100%) of the stocked fish were gone within 7 days. • Larger vents sizes had faster exit rates. • No species-specific tendencies were observed in exit although the larger vent sizes exhibited significant changes in species composition at all set lengths.
Experimental Design • Standard St. Thomas Fish Traps • Rectangular and Arrowhead Design. • Set in Strings of 10 • Fishermen told to “fish them like they normally do” during field testing. • Vents (2 per trap on the away from the funnel “front” side) • Control (no vent) • 1 by 53/4 inch vent • 1 inch vent along entire (18 inch) edge of trap • 11/4 by 53/4 inch Vent • 11/4by 93/4inch Vent • 13/8 by 53/4inch Vent • 11/2by 53/4inch Vent • 13/4 by 53/4 inch Vent • Vents in Random order on trap string
Field Testing Series • Phase 1 field testing with vents from diving studies. • Phase 2 Field testing. 1 by 53/4, 1 3/8 by 53/4, 1 3/8 by 93/4, 11/2 by 53/4 and control traps. • Phase 3 testing. 1 by 53/4, 1 3/8 by 53/4, 1 1/4 by 53/4 (top of trap), 1 1/4by 53/4 (bottom of trap) and control traps. • Phase 4 testing. 1 3/8 by 53/4 placed on the front and back top and bottom to test for vent location.
Field Testing Summary Results: General • Average Catch/Trap Haul does not stabilize until > 40 trap hauls. • No difference between rectangular and arrowhead traps • Catch/trap haul not correlated with set length. • Catch/trap haul not correlated with temperature. • Lunar affects (catches greater and fewer empty traps around full moon). • Seasonal peaks for most species. • Lionfish from 0 to 19th most common species at end of study. • Mortality rate (0.031fish/day ) similar to diving studies and Renchen (2010) study (0.025fish/day ).
Gear Selectivity Where: Sis Selectivity and and are calculated iteratively via nonlinear regression. From the non-linear model (Proc NLIN in SAS) with known values of size class and percent of the sampled population for that size class. The output was estimates of both parameters, which were then used within the selectivity equation to estimate size selectivity for each size class and particularly the size class at which selectivity peaked.
Total Mortality Rate Size Frequency distributions for the most common species were analyzed for total mortality Z (equation 1). Where: is the number of fish at time (t) and Z is the rate of total mortality. An age specific instantaneous rate of Z was calculated by solving the Von Bertalanffy growth equations (equation 3) for t (median age of the size class in the frequency distribution. (2) Where: is the length (in mm) at age (t).is the asymptotic length at which growth is zero. t0is included to adjust the equation for the initial size of the organism and is defined as age at which the organisms would have had zero size. Solving equation (2) for t (age) allows for calculation of the age (in years) of each size class. (3) The annual total mortality rate (shown in equation 5
Field Testing Summary Results: Vents • Box fish. Only 2 by 4 and 13/4by 53/4 vents let out boxfish and these also had very low retention of commercial catch. Study then concentrated on release of thin bodied not-box fish (TBNBF). • Vent height. • 1 inch by 18 had significant release of TBNBF and retention of commercial species. • 1 by 4 released significantly less TBNBF than 1 by 6 in pilot study. • 13/8 by 9 3/4Vent did not release more TBNBF than 13/8 by 53/4. • Vent Width. 11/4by 5 3/4 and 13/8 by 5 3/4both has good release of TBNBF and retention of catch but 13/8 by 5 3/4had better release of bycatch. • Vent Location. Top and bottom not significant but vents in front (away from funnel) side had significantly higher release rates. (Contrasts with diving observations).
Implementation • Fishermen from Phase 4 of study are leaving vents in. (Julian Magras, Daryl Bryan, Tony Blanchard and Danny Berry) • Proposal to Bycatch Reduction Program. • Fishermen install vents in one string. • Port Sample vent string and one regular string. • If convinced project to supply vents for remainder of traps. • Council/Territorial Regulation.