Download
1 / 17
170 likes | 334 Views
Total Lightning Observations of Supercells over North Central Texas. Chris McKinney Larry Carey, Greg Patrick, Richard Orville. Goals. Evaluate visual signatures of supercell intensity/severity, structure, and movement in total lightning data used at WFO FWD

E N D
Total Lightning Observations of Supercells over North Central Texas Chris McKinney Larry Carey, Greg Patrick, Richard Orville
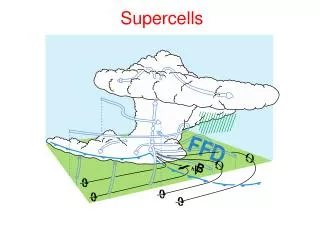
Goals • Evaluate visual signatures of supercell intensity/severity, structure, and movement in total lightning data used at WFO FWD • emphasis on Flash Extent Density (FED) • Compare trends in FED to those in VHF total flash rate, a previously researched quantity • Compare total lightning displays to structure and intensity data from Doppler weather radar • radar reflectivity and velocity
D/FW LDAR-II Network • Nine sensor VHF network owned by Vaisala • Seven sensors operational during dates in this study Adapted from Patrick and Demetriades (2005)
Flash Extent Density • Gridded measure of VHF flash detection • 2 km x 2 km grid • display is number of individual flashes passing through each grid box
25 April 2005 • Two tornadic supercells over the southern half of the DFW metroplex • Five tornadoes reported, as well as numerous severe hail reports
Second Lightning Hole • Another lightning hole occurs with same cell at 2234 UTC • FED imagery “fills in” the lightning hole compared to GSD CW from top left: 6-9km GSD, 9-12km GSD, 12-15km GSD, and FED (0-20km)
05 April 2005 • Linear MCS moves across D/FW network • Left moving supercell located within the line moves across central Dallas County Time series of 0.5° reflectivity from KFWS WSR-88D, 2309 - 2339 UTC
13 April 2007 • Linear MCS with an embedded supercell moved across North Texas • Three tornadoes reported in Tarrant/Dallas counties, including EF-1 tornado in Haltom City
FED Rear Notch 2326 UTC 13 April 2007 2354 UTC 13 April 2007
FED Rear Notch • KFWS images from 0001 UTC on April 6, 2005 • bowing reflectivity on 2.4° • outbound velocities 50-70kts • 50kt wind gust recorded near Allen, TX at 0015 UTC • top: 1.5º Z/V bottom: 2.4º Z/V
Conclusions • FED displays important features of storm structure and evolution • updraft intensity, location and propagation • Identification of these features similar to early weather radar research (i.e., hook echoes) • LDAR data coverage aids in situations where radar cannot scan effectively • cone of silence • radar inoperative
Conclusions • Trends in FED time series show some positive correlation to total flash rate • More work is needed to evaluate what is a significant “jump” in FED data