Download
1 / 16
160 likes | 167 Views
Latino Influence in the 2008 Election. Latinos and the 2008 Elections Lecture 13 November 13, 2008. Exam – November 20. My goals Analysis and comparison – essay Reward for careful reading of assigned readings – identifications Decisions for you

E N D
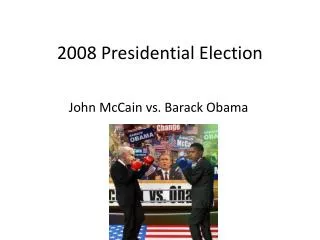
Latino Influence in the 2008 Election Latinos and the 2008 Elections Lecture 13 November 13, 2008
Exam – November 20 • My goals • Analysis and comparison – essay • Reward for careful reading of assigned readings – identifications • Decisions for you • Other formats that will accomplish these goals? • If not, • Balance between sections • Essay question in advance?
From Last Time Latino Voting in 2008
Latinos and Other Races – Federal Offices • Texas Senate Race • John Cornyn (R- incumbent) 55 percent vs. Rick Noriega (D) 43 percent • Latino vote – Cornyn 36 percent / Noriega 61 percent • African American vote – Cornyn 8 percent / Noriega 89 percent • U.S. Congress • NM 3 – Ben Lujan (D) – 57 percent vs. Daniel East (R) – 30 percent • Three South Florida Congressional races – All Latino incumbents (Republicans) won • Louisiana 2 – Helena Moreno (D) – 43 percent vs. William Jefferson (D – incumbent) – 57 percent
Latinos and Other State Races • California Proposition 11 – “Voters First Act” • Yes – 50.7 percent No – 41.3 percent • Governor has declared victory • Colorado Amendment 46 – “Colorado Civil Rights Initiative” • Yes – 49 percent No – 51 percent • Nebraska Initiative 424 – End affirmative action • Yes – 58 percent No – 42 percent • Arizona Proposition 202 – Identity theft • Yes – 41 percent No – 59 percent • No exit poll (no data on Latino vote) on these initiatives
Of Course, Now the Real Work Begins • Evidence is that Obama transition team is ready for this responsibility • Others in similar position have not been • Demands will come from all quarters, including demands to ensure that the Obama administration is diverse on multiple measures • Latinos will seek senior positions in the administration • Bill Richardson • The Obama campaign did not have an obvious cadre of Latino leaders who would move to cabinet posts • Most “national” Latino leaders supported Sen. Clinton, at least initially
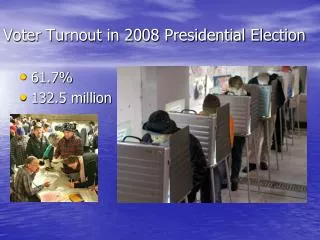
Electoral Rules and Participatory Outcomes Rhetoric of huge growth in the electorate overstated - 2004 turnout – 122.3 million (60.6%) - 2008 turnout (estimated) – 126.5 – 128.5 million (60.7% - 61.7%) - Expected change in youth vote not evident
Registration Stagnation in States Without Competitive Presidential Races No reliable turnout data yet, so analysis of registration changes 2004-2008
So, • Preliminary evidence (registration, not turnout data) shows that • Non-competitive states saw less mobilization • Latinos much more likely to live in non-competitive states • We don’t yet know (and won’t know until the summer 2009 CPS data release) • Whether “new” registration was equally distributed across race/ethnic groups (I doubt it) • Whether the newly registered turned out at the same rates as the non-newly registered
Direct Latino “Influence” in 2008, Preliminary Assessments As you might expect, it depends on your standard
If the Standard is No Latino Voting (Weakest Standard) • Latinos were quite influential in three to four battle ground states – New Mexico, Indiana, Florida, and, perhaps, North Carolina • Had these states all given their electoral votes to McCain, Senator Obama would still have had more the 300 electoral votes and the presidency
Non-Latino and Latino Preferences, States that Would Have Flipped There was no exit poll of Latino voters in North Carolina. Obama carries the state
Can We Apply the More Rigorous Standard – Change in Outcome Because of a Change in the Latino Electorate? We won’t really know until we get group-specific turnout data in the summer That said, it looks like Florida meets that standard and, maybe, Indiana Problem, we don’t have much historical data on Latino votes in Indiana
Other Groups Can Make Similar Claims • Most obvious – African Americans • Very strong support for Obama – 95% to 4% • We assume a surge in Black voting • Another group of interest to us – Latino immigrants (naturalized U.S. citizens) • Latino immigrant vote nationally – 78% Obama to 21% McCain • NC – 14,000 vote Obama victory / 26,000 Obama vote advantage by Latino naturalized citizens • IN – 26,000 vote Obama victory / 24,000 vote Obama advantage by Latino naturalized citizens
For Next Time • 2008 as a realigning election • Preliminary evidence • Latino contributions • Regardless – thinking about the future of the Latino vote • Not just a national phenomenon • Importance appears regardless of whether 2004 or 2008 is the norm