Download
1 / 24
240 likes | 324 Views
Historical trends and multi-model ensemble forecasting of extreme events. Dr. Caio A. S. Coelho University of Reading, U.K. E-mail: c.a.d.s.coelho@reading.ac.uk Thanks to: David Stephenson, Mark New, Bruce Hewitson + Africa extremes workshop participants. Talk plan. What are extremes?

E N D
Historical trends and multi-model ensemble forecasting of extreme events Dr. Caio A. S. Coelho University of Reading, U.K. E-mail: c.a.d.s.coelho@reading.ac.uk Thanks to: David Stephenson, Mark New, Bruce Hewitson + Africa extremes workshop participants
Talk plan • What are extremes? • Historical trend analysis of extremes in Africa • What is going to happen to extremes in the future? - Extreme event forecasting
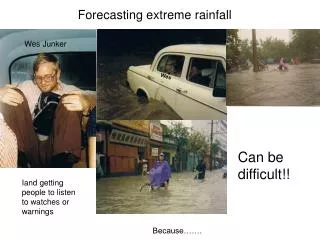
Examples of wet and windy extremes Convective severe storm Hurricane Extra-tropical cyclone Polar low Extra-tropical cyclone
Examples of dry and hot extremes Drought Dust storm Wild fire Dust storm
IPCC 2001 definitions Simple extremes: “individual local weather variables exceeding critical levels on a continuous scale” Complex extremes: “severe weather associated with particular climatic phenomena, often requiring a critical combination of variables” Extreme weather event: “an event that would normally be as rare or rarer than the 10th or 90th percentile.” Extreme climate event: “an average of a number of weather events over a certain period of time which is itself extreme (e.g. rainfall over a season)”
Some properties of extreme events 90th percentile Severity large impacts (extreme losses): • Injury and loss of life • Damage to the environment • Damage to ecosystems Extremeness large values of meteorological variables: • maxima or minima • exceedance above a high threshold • exceedance above all previous recorded values (record breaker) Rarity/frequency small probability of occurrence Longevity • Acute: Having a rapid onset and following a short but severe course • Chronic: Lasting for a long period of time (> 3 months) or marked by frequent recurrence
Southern and West Africa workshop on weather and climate extremesCape Town, South Africa, 31May - 4 June2004 Organization: • Expert Team on Climate Change Detection Monitoring and Indices (ETCCDMI) • WMO Commission of Climatology (CCI) • Climate Variability and Predictability (CLIVAR) project Aim: Derive indices from daily data to measure changes in extremes Participants: 14 countries Data: 63 stations (1961-2000) daily (minimun and maximum) temperature and precipitation New, M., B. Hewitson, D. B. Stephenson, A. Tsiga, A. Kruger, A. Manhique, B. Gomez, C. A. S. Coelho, D. N. Masisi, E. Kululanga, E. Mbambalala, F. Adesina, H. Saleh, J. Kanyanga, J. Adosi, L. Bulane, L. Fortunata, M. L. Mdoka and R. Lajoie, 2005: Evidence of trends in daily climate extremes over Southern and West Africa, Submitted to J. Geophys. Res. (Atmospheres).
Workshop methodology Software: RClimDex ( http://cccma.seos.uvic.ca/ETCCDMI/ ) Data quality control • negative precipitatoin • max. temp. < min. temp. • search for outliers based on threshold defined in terms of standard deviation from the long-term (1961-2000) daily mean • visual inspection of time series plots Computation of climate indices using RClimDex • 15 temperature indices • 10 precipitation indices Trend estimation and interpretation of results
Trends in temperature extreme indices Source: New et al. 2005 (submitted to J. Geophys. Res. (Atmospheres).) Maximum Minimum Cold day frequency Cold night frequency Cold T< 10th percentile Hot day frequency Hot night frequency Hot T> 90th percentile
Summary of findings for temperature extremes in Africa 10th percentile 90th percentile • Shift in the frequency distribution towards larger values • Frequency of extremely cold days and nights has decreased • Frequency of extremely hot days and nights has increased
Trends in precipitation indices Source: New et al. 2005 (submitted toJ. Geophys. Res. (Atmospheres).) Annual total precip. > 95th perc. Annual total precipitation no of days with prec. > 20 mm Max. no of consec. dry days Longest dry spell Very heavy precipitation day
Summary of findings for precipitation indices in Africa • No trends found in many stations • Only a few stations show statistically significant trends • Some stations are getting drier • Longest dry spells are getting longer for a few stations
Suggestion for collaboration work Perform similar extreme indices analysis for Cuban stations Required tools: • RClimDex ( http://cccma.seos.uvic.ca/ETCCDMI/ ) • R ( http://www.r-project.org/ ) (both are freely available) Such study will allow us: • To identify how extremes behaved in the past in Cuba • To diagnose observed changes in extremes in Cuba • Compare results with findings of Caribbean climate and weather extremes workshop held in Jamaica 2001
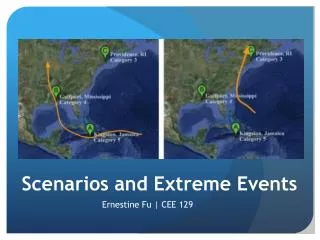
What is going to happen to extremes in the future?Extreme event forecasting
ENSEMBLES: ENSEMBLE-based Predictions of Climate Changes and their ImpactsWP4.3:Understanding Extreme Weather and ClimateEvents us! Provision of statistical methods for identifying and forecasting extreme events and the climate regimes with which they are associated. More robust assessments of the effects of climate change on the probability of extreme events and on the characteristics of natural modes of climate variability. How best to make probability forecasts of extremes? multi-model ensemble tail probabilities Need to develop: Multi-model calibration andcombination approach for extremes
Calibration and combination of multi-model ensemble seasonal forecasts:South American rainfall example
Conceptual framework “Forecast Assimilation” Data Assimilation
DJF rainfall anomalies for 1975/76 and 1982/83 Forecast Assimilation Obs Multi-model La Nina 1975/76 ACC=0.59 ACC=-0.09 El Nino 1982/83 ACC=0.32 ACC=0.56 (mm/day)
Summary of multi-model ensemble forecast calibration and combination • Forecast assimilation: Unified framework for calibration and combination • Useful approach for improving skill of South American rainfall seasonal forecasts • Similar approach will be developed for extreme event forecasts in ENSEMBLES
The EUROBRISA ProjectLead Investigator: Dr Caio CoelhoKey Idea:To improve seasonal forecasts in S. America:a region where there is seasonal forecast skill and useful value. http://www.met.rdg.ac.uk/~swr01cac/EUROBRISA • Aims • Strengthen collaboration and promote exchange of expertise and information between European and S. American seasonal forecasters • Produce improved well-calibrated real-time probabilistic seasonal forecasts for South America • Develop real-time forecast products for non-profitable governmental use (e.g. reservoir management, hydropower production, and agriculture) EUROBRISA was approved by ECMWF council in June 2005
Climate Analysis Group http://www.met.reading.ac.uk/cag/ Aim: develop and apply statistical analysis techniques to improve both understanding and predictive capability of weather and climate variations Main areas of interest: • climate modes and regimes e.g. NAO and Asian Monsson • weather and climate extremes • Forecast verification, combination and calibration