Download
1 / 23
230 likes | 392 Views
The use of WSR-88D radar data at NCEP. Shun Liu 1 David Parrish 2 , John Derber 2 , Geoff DiMego 2 , Wan-shu Wu 2 Matthew Pyle 2 , Brad Ferrier 1 1 IMSG/ National Centers of Environmental Prediction, Camp Springs, Maryland

E N D
The use of WSR-88D radar data at NCEP Shun Liu1 David Parrish2, John Derber2 , Geoff DiMego2 , Wan-shu Wu2 Matthew Pyle2 , Brad Ferrier1 1IMSG/ National Centers of Environmental Prediction, Camp Springs, Maryland 2NOAA/National Centers of Environmental Prediction, Camp Springs, Maryland
OUTLINE • Radar data processing at NCEP • High resolution forecast initialization with radar data
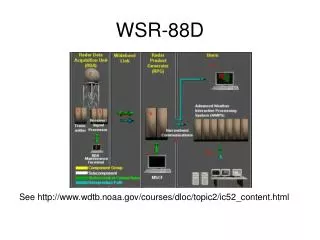
WSR88D-Radar Data Processing at NCEP Problems of radar data processing in operations: • the relatively large volume of radar data restricting the data to be transmitted to the operational center in real time • the radar data decoding software and storage taking excessive computational resources • the quality control (QC) problems of radar data further limiting the applications of radar data for operational use
WSR88D-Radar Data Processing at NCEP Radar data received at NCEP: • Digital Precipitation Arrays (DPA) • VAD wind (velocity azimuth display) • WSR88D Level-III (NIDS) data • WSR88D Level 2.5 data • WSR88D Level-II data
QC Parameters Mean reflectivity (MRF) Velocity data coverage (VDC) Along-beam perturbation velocity sign changes (VSC) Along-beam velocity sign changes(SN) Standard deviation of radial wind (STD)
Along beam velocity sign change (SN) 23% KBUF 2009090513 Threshold to reject data 6% KFWS 200909110605
Performance of radar data QC analysis (m/s) analysis (m/s) Observation (m/s) Observation (m/s) after QC before QC
With QC Goes image
HiRes Initialization with radar data • The radial wind is directly analyzed by GSI. • The cloud analysis package developed by GSD is modified and used to analyze reflectivity with NCEP’s forecast model background. • Hourly cycle is used
HiRes Initialization with radar data • After complex radial wind quality control, level II radial winds are used in GSI analysis. • 3D reflectivity mosaic from level II data are used in cloud analysis. • Metar and Satellite observations are used in cloud analysis to detect cloud. • Latent heat estimated from reflectivity is used to adjust background temperature. • After radial wind and reflectivity assimilation, wind, temperature, rain water mixing ratio, cloud water and cloud ice mixing ratio and specific humidity are upgraded.
03 Test case on 2011091800 04 Forecast start at 00z 05 CTL: forecast without Radar data assimilation EXP: forecast with radar data assimilation 24
CREF obs divergence EXP-CTL at the end of data assimilation cycle wind divergence conv div Low level CREF ctl High level div conv
hPa/3h Forecast hour Domain average of absolute pressure change per 3h
03 09 06 12 15 18 ctl CREF ETS score exp 10 day parallel run from 20110918 --- 20111013
21 24 27 30 36 33
Challenges of radar data assimilation do we get cross-beam wind information with current 3DVAR system? Vector wind Analysis Increment Most of analyzed wind increments are along the radial direction. GSI analyzed wind increment
Challenges of radar data assimilation • Examine if DFI can distribute wind increment from Vr assimilation to other model variables. T increment through DFI is small. Q increment is relative large through DFI • 2. Add new constrains in GSI to get balance between wind and other variables. How to get balance between wind and other model variables?
Future plan • Continue to test current hourly data assimilation system for HiRes initialization. Will try to extend current 2 hour assimilation window to 6 hour or change assimilation interval to half hour. • Consider including diabatic digital filter treatment. • May consider to use radar data in hybrid ensemble data assimilation system. • Improvement of radar data quality control package at NCEP is constantly needed. We will need to process TDWR, Dual-pol and Canadian radar data in near future.