Download

1 / 31
330 likes | 456 Views
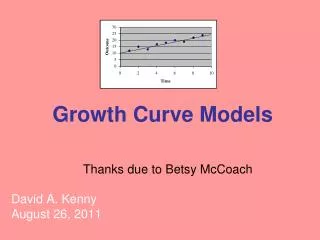
Growth Models. Including a detailed description of the Colorado Growth Model. Overview. Review Growth Model Options Details on Colorado Growth Model Major technical questions. Basic Definitions.

E N D
GrowthModels Including a detailed description of the Colorado Growth Model
Overview • Review Growth Model Options • Details on Colorado Growth Model • Major technical questions
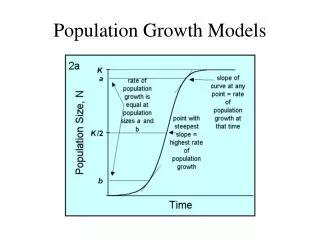
Basic Definitions • Status describes the academic performance of a student or group (a collection of students) at a single point in time. • Growth describes the academic performance of a student or group (a collection of students) over two or more time points. • A growth model is a collection of definitions, calculations, and rules that quantifies student performance over two or more time points and supports interpretations about students, their classrooms, their educators, and their schools.
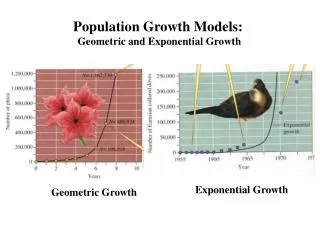
School-level “Growth” Measures • Year to Year changes in percent met • safe harbor • Grade to Grade changes in percent met or average scores • How are my fifth graders doing compared to my fourth graders • Cohort growth over time in percent met or average scores • How has my 2009-10 third grade class performed overtime
Growth Models • A growth model is a collection of definitions, calculations, and rules that quantifies student performance over two or more time points and supports interpretations about students, their classrooms, their educators, and their schools. • Most growth models follow individual student growth, and these are the subject of discussion today.
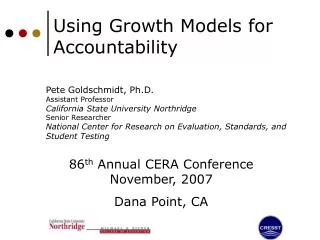
Common Growth Models • Gain Scores • Trajectory • Categorical • Residual Gain • Projection • Student Growth Percentiles • Multivariate
Key Questions Growth Models • What interpretation does the growth model support • Formative? School accountability? Teacher evaluation? Program Evaluation? • What is the statistical foundation? • Gain-based, enhanced status, multivariate • What are required data features? • Vertical scale? Articulated cut scores? Large datasets? Factors beyond test scores? • What interpretations does the model support? • Does aggregation at the school level make sense? • Does the model include growth to standard? • What are common misinterpretations and threats to validity?
Gain Scores • Definition: Calculates the gain in a student’s test score from year to year. Example: 5th grade math score – 4th grade math score • Requires: vertical scale. • Strengths: very easy to calculate, very easy to aggregated • Weaknesses: may not be very reliable, easier to manipulate, poor vertical scale lessens value. • School measure: average gains • Oregon data: Gains vary by previous performance levels, see next slide.
Trajectory Model • Definition: If a student continues on this path, where will she be in the future (Oregon’s current model) • Requires: vertical scale useful, but not required • Strengths: Simple to compute • Weaknesses: assumes students make same growth year after year, targets for student already meeting may be difficult to determine • School measure: percent of students “on track” • Oregon data: see next slide.
Categorical Model • Definition: evaluates students transitioning between performance levels • Requires: cut scores, benefits from articulated cut scores • Strengths: useful when vertical scale not available • Weaknesses: coarse measure of student progress • School measure: percent on track or weighted index of students improving their performance levels • Oregon data: none
Residual Gain Model • Definition: student gains are measured against “expected gains.” This is an “enhanced status model.” • Requires: state level data, model to predict expected gains, does NOT require vertical scaling • Strengths: value added measure, statistically robust - many statistics can be derived from the measure (median, standard deviation, school variability) • Weaknesses: does not directly measure growth, growth to standard is an add-on • School measure: average residual gains. • Oregon data: gains are based on the mean gain, conditioned on the prior test score. See next slide.
Projection Model • Definition: uses a regression model to predict future scores. (Oregon’s federal growth model pilot submission was a hybrid of this model and a trajectory model) • Requires: linear regression model, state level data. • Strengths: empirically grounded: uses historic data to help predict current student’s performance, can use data from multiple subjects, supports growth to standard • Weaknesses: assumptions, such a linear growth, are often untenable. • School measure: average predicted score, percent of students “on track” • Oregon data: I’ve looked at versions of this, but don’t have pretty data to present.
Student Growth Percentiles • Definition: student growth compared to other students with similar score histories, expressed as a percentile. It is an “enhanced status model”. • Requires: state data, large data sets, does NOT require vertical scale • Strengths: includes growth to standard algorithm, is value added • Weaknesses: complex model • School measure: median or mean growth percentile. • Oregon data: see next slide and later in this presentation.
The Colorado Growth Model • Basic Assumptions • Sample Data • Adequate Growth • Major technical decisions
Quick Description • Students with two consecutive years of test scores are provided with a growth percentile. • Student growth is compared to “academic peers”, who are students with similar score histories. • A student growth percentile of 60 means the student “grew” as much or more than 60 percent of students with similar test score histories. • Various percentiles of growth can be projected into the future to determine “Adequate Growth Percentiles”
Glossary • Academic Peers – students with the same or similar test scores in the past. • Student Growth Percentile (SGP) – the growth of the student as compared to her academic peers • Adequate Growth Percentile (AGP) – the growth percentile that needs to be sustained in order for the student to meet or still meet standard in 3 years.
Student Growth Report Student reports can include the following: • Student test history • Current Growth percentile – is the growth low, average, or high • Scores that correspond to 1st,35th, 65th and 99th percentile (for comparison) • Projections into the future for various growth percentiles
Aggregations at School Level • Median SGP by subgroup • This is the recommendation by the SGP author, though others recommend mean • Median AGP by subgroup • This is the recommendation of the SGP author, though others recommend mean • Subgroups Making Adequate Growth • Comparison of the median SGP and the median AGP. • Percent meeting AGP • This is not in the proposed school ratings model.
Now the Complications • SGPs -- The model can take into account more than two years of data for each student • By using more than two years of data we may get a better estimate of the student’s growth. • See the next slide for examples
SGPs – Higher Order Growth This data show how 3 years of test scores can affect growth percentiles.
Focus and Priority Schools • New “rating” system that will identify focus and priority schools. • Growth is a very strong factor in the rating.
Contact Information and Links • Details on the waiver: http://www.ode.state.or.us/go/nextgen • Details on priority, focus, and model schools: http://www.ode.state.or.us/search/page/?id=3742 • Priority, Focus and Model School Detail Sheets: http://www.ode.state.or.us/search/page/?id=3749 • Policy and Technical Manual: http://www.ode.state.or.us/wma/policy/accountability/nextgen2012/nextgenaccountabilitymanual2012.pdf • Jon Wiens • Email: jon.wiens@state.or.us