Download
1 / 27
280 likes | 427 Views
Methane in the atmosphere and indirect effects Ivar S.A. Isaksen CICERO/University of Oslo. Surface temperature anomalies relative to 1951–1980 Surface air measurements: Meteorological stations, Ship, Satellite, SST measurements Global annual mean temperature

E N D
Methane in the atmosphere and indirect effects Ivar S.A. Isaksen CICERO/University of Oslo
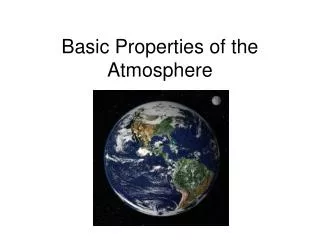
Surface temperature anomalies relative to 1951–1980 • Surface air measurements: • Meteorological stations, Ship, Satellite, SST measurements • Global annual mean temperature • 2001-2005 surface anomaly relative to 1951-1980
Impact on climate from different compounds Except for CO2 and black carbon, all compounds are affected by climate/chemistry interactions, either through emission or perturbed by atmospheric chemistry and climate change
Radiative forcing since pre-industrial time Isaksen et al. (2009) Radiative forcing estimates of atmospheric compounds from the pre-industrial period 1750 to 2007 Estimates of the impact of short-lived compounds (O3, Stratospheric H2O) and particles have large uncertainties
Impact of enhanced NOx emission on ozone and methane (through OH) Contribute to RF through chemistry: Reduced CH4 through reduced lifetime Formation of the secondary compound O3 Reduced CH4 (through formation of the hydroxyl radical (OH)): NO + HO2 → NO2 + OH CH4+ OH → CH3 + H2O Ozone production: NO + HO2→ NO2 + OH NO2 + UV-light → NO + O O + O2 + M → O3 + M Increased climate effect from O3, Reduced climate effect from methane Formation and loss of OH NO + HO2→NO2 + OH CH4+ OH → .. + CO + H2O CO + OH (+ O2)→ CO2 + HO2 (main loss for CO and OH)
Global gridded methane emissions in the year 2005 (unit ton CH4 per grid cell). ! Solely anthropogenic sources and biomass burning not included
Observations of methane for the period 2001-2010 at Zeppelin observatory, 79 deg. N
Impact on methane lifetime from the transport sector Methane lifetime (yr) and relative changes due to traffic emissions, estimated in different model. July zonal average OH perturbations Hoor et al. (2009)
Impact on climate from Arctic thawing ↑ ↓ Increased RF CH4↑ ↓ ← ← CO2 CH4 ←
Sources for Arctic release of methanePermafrost thawing: Conversion of organic carbon to methane under anaerobic conditionsTemperature increases on shallow sea floors: Methane releasefrom gas hydratesChanges in wetlands: Enhanced/reduced emission The rate and time horizen of emission highly uncertain: More focused studies urgently needed
Impact on chemically active climate gases in a warmer climate Permafrost thawing with enhanced emission of CH4 - Long term impact on global climate Ozone increase during frequent high pressure systems - Regional pollution Warmer climate - Enhanced permafrost thawing→ Release of greenhouse compounds (CH4,CO2) - More severe pollution episodes (ozone, particles) - Changes in emission of biogene compounds (isoprene, nitrogen oxides) - Changes in atmospheric oxidation (increaced OH → reduced CH4) Atmospheric chemical changes non linear - Not a 1 to 1 relation between release and atmospheric changes (CH4 a factor 1.5) - Formation of secondary compounds (O3, sulfat) depends on precursors
Radiative forcing • The lightest colors refer to the 4 × CH4. • The medium light colors to the 7 × CH4. • The dark colors to the 13 × CH4 case.
Studies of impact and adaptation of control measures A key question for estimates of future impact is the adoption of realistic emission scenarios - Even on a time scale of a few decades scenarios show a wide spread in the scenarios Estimates of climate contribution require studies of the compounds with highly different lifetimes - Appropriate metrics need to be adopted Several key compounds involved in climate change are affected by atmospheric chemistry - The role of climate-chemistry interaction need to be better understood Adaptation of control measures to reduce the climate impact require a Sector wise approach - This is important since the sectors emit different compounds with different climate impact
Future work Estimate OH-methane feedback factors for current an future conditions Studies of non-linear processes Better estimates of future emission changes Impact of climate change (dynamics, temperature, surface conditions) Improved model predictions Multi model studies Comparisons with observations; satelittes and ground based Model/Model comparisons of key compounds (OH) Impact of different sectorial and regional emissions Contribution from specific processes Different effects of regional emissions Main compounds affecting methane in the atmosphere OH, NOx, CO, O3
Impact on climate from Arctic thawing ↑ ↓ Increased RF CH4↑ ↓ ← ← CO2 CH4 ←
Methane emissions in the Arctic during permafrost thawing Max RF for a pulse of 5 Gt: 1.1 W/m2 Global metane increase for pulses of 5 Gt (green), 50 Gt (lilac), and continous emission of 0.8 Gt/year (black)
Emission index for different sectors Large sectorwise differences in NOx/CO emissions : Impact on OH and CH4 lifetimes Aircraft emissions: NO2/CO > 1 Ship emissions: NO2/CO >> 1 Surface emissions: NO2/CO << 1 Changes in global average OH and CH4 lifetime from ship emissions (2000)
RF from ship emissions 2000-2007 Radiative forcing (RF) (mWm-2) of ozone and methane changes due to increasing ship emissions over the period 2000-2007. In the methane calculations the concentration change after a turnover time of 12 years was used.
Surface ozone generation during summer (Studied with the Oslo CTM2) Northern mid latitudes: Persistantly high ozone levels during summer months. Determined by emissions of pollutants and weather pattern
Mean column ozone perturbations due to all types of transport, as simulated by the TM4, LMDzINCA, OsloCTM2 and p-TOMCAT models (ensemble mean) for January (left) and July (right). Bottom panels: Corresponding relative standard deviations for January (left) and July (right) (from Hoor et al., 2009).
Concentration changes: tropospheric ozone column Shipping Oil and gas • Secondary component –NOx important precursor • NOx emissions are larger from shipping than from oil and gas • The ozone column response is largest for shipping
Radiative Forcing from ozone [mW/m²] Shipping Oil and gas • Dominant effect from shipping emissions • Emissions of NOx is larger from shipping than from oil and gas
Mean column ozone perturbations due to all types of transport, as simulated by the TM4, LMDzINCA, OsloCTM2 and p-TOMCAT models (ensemble mean) for January (left) and July (right). Bottom panels: Corresponding relative standard deviations for January (left) and July (right) (from Hoor et al., 2009).