Download
1 / 28
280 likes | 286 Views
Impact of the catchment land use on some factors of lakes trophic status: a GIS approach. Łukasz Sługocki, Robert Czerniawski Department of General Zoology University of Szczecin, Poland. Background. Artificial enrichment of lakes. http://www.nysfola.org/. Background.

E N D
Impact of the catchment land use on some factors of lakes trophic status: a GIS approach Łukasz Sługocki, Robert Czerniawski Department of General Zoology University of Szczecin, Poland
Background Artificial enrichment of lakes http://www.nysfola.org/
Background CulturalEutrophication(acceleratedaging) The excessive addition of Inorganic nutrients (phosphorus and nitrogen) Organic mater (live & dead plants & animals) Soil particles to a lake
Background . Basinscale Hydrological cylce dynamics regulate the amount of water in freshwater ecosystem, which is potantially a limiting factor for primary productivity and hence vegetation development. Therefore, water is one of the major driving forces for ecological processes at the catchment scale (Zalewski et al. 2004).
Background Catchemnt Size The retention of nutrient has been reported to increase with catchment size, resulting in a spatial “scale effect” of observed nutrient losses per unit area (Ekholm et al., 2000).
Background Anthropogenic pressure results in degradation of landscape (deforestation, unsustainable agriculture and urbanization) and the biotic structure of freshwaters and thus leads to modification of evolutionarily established cycle (Zalewski et al. 2004). Fig. 1. Phosphorus export coefficients (http://www.nysfola.org/).
Background Threat to ecosystem services Ecological impact Fig. 2. Trophic food web.
Background Ice began melting about 10,300 BP Lake aging since last glacier period Fig. 3. Europe during the last glacial period.
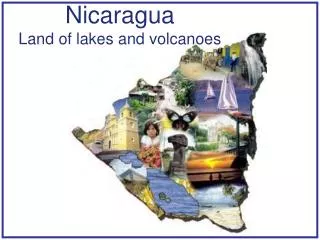
Background Pomerania Now 3 385 lakes >1ha (area of 104 219 ha) But in 1954s 4 129 lakes >1ha (area of 115 280 ha) Poland Decline from 9296 lakes >1ha (1954) to 7081 lakes >1ha (1975) Polska podobnie jak kraje południa europy boryka się z deficytami wody Poland Fig. 4. Lakes in north Poland.
Background Perception of Lake Quality
Background Water clarity Angelo Secchi Created in 1865 29 June 1818 – 26 February 1878
Background Secchi disc • Simple • Low cost clarity measurement • Indicator of eutrophication degree • Measurement variability
Background Conductivity • Abrupt changes in conductivity might indicate that water or wastes are being diverted into the water body. • In many cases, conductivity is linked directly to the total dissolved solids. • Conductivity measurements made to determine water purity will not respond to non conductive contaminants (many organic compounds fall into this category).
Aim of study The basic aim of these studies is to determine land use impact on transparency and conductivity of waters.
Study lakes Lakes surface area range from 25ha to 3500ha. Fig. 5. Area (ha) of the lakes under study.
Study lakes The values of lakes depth range from 12m to 83m. Fig. 6. Depth (m) of the lakes under study.
Study lakes The values of lakes mean depth range from 5m to 19m. Fig. 7. Mean depth (m) of the lakes under study.
Study lakes Measurement of the lakes water was performed in the summer period (from 15 July to 15 August) 2011-2014 once for each lake. The study covered 31 stratified lakes located in northwestern Poland. These lakes were chosen on account of their considerable recreation value and economic importance. 329 prób zooplanktonu pobrano z 79 jezior Fig. 8. Location of study lakes and catchment land use.
Study lakes Local catchments and network catchment of studied lakes were prepared using QGIS Wien (2.8.7). The land use variables were prepared with Corine Land Cover, 2006 (CLC2006) (Büttner & Kosztra, 2007).
Land use of studied catchments Land use of studied drainage basins is largely dominated by forested land, which covers 52% of the watershed. Agricultural areas cover 37% of the basin. Water bodies cover 10% of the total area. Artificial surface (1%) is relatively low. Wetlands cover less than 1%. Fig. 9. Catchments land use.
Methods Measurement location
Methods The correlations between the percentage of land use vs. Secchi depth and electrical conductivity were analyzed with Pearson coefficient correlation (P < 0.05) (Statistica 10). Secchi depth (m) Conductivity (µS/cm) Fot. Hydrolab DS5 Fot. Secchi disc (Limnos)
Results TSI(SD) = 60 – 14.41 ln (SD)(Carlson, 1977) According to Carlson index the studied lakes ranged from mesotrophic to eutrophic. eutrophy mesotrophy meso-eutrophy Fig. 10. Trophic status of the study lakes, identified on the basis of the TSISD value.
Results Significant correlation for Secchi depth values covers only network catchment area (P < 0.05). Secchi depth values was significantly positively correlated with percentage of forest and water in catchment and significantly negatively with agricultural areas (P < 0.05). Fig. 11. Significant correlations (P<0.05) between percentage of catchment land use vs. values of Secchi depth (m).
Results Fig. 12. Significant correlations (P<0.05) between percentage of catchment land use vs. values of conductivity (µS cm-2). Value of conductivity was significantly positively correlated with percentage of forest in local and network catchment, wetlands in network catchment (P < 0.05). Values of conductivity were significantly negatively correlated with percentage of forest in local and total catchment (P < 0.05).
Conclusions • The results demonstrate that land use in catchment area of lakes affects transparency and conductivity that are variables determining trophic changes. • Further research should be conducted to address issues such as the impact of land use on water bodies. • Results of the present study can be important in water management and environmental studies of lakes and their catchment area. • The study also point to the usefulness of GIS tools and its databases for evaluation of land use influence on increase of lakes trophic status.