Download
1 / 15
150 likes | 382 Views
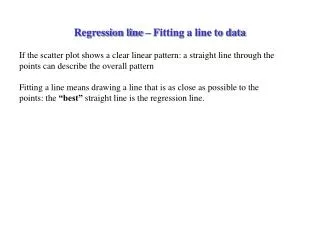
A Short Introduction to Curve Fitting and Regression by Brad Morantz. Overview. What can regression do for me? Example Model building Error Metrics OLS Regression Robust Regression Correlation Regression Table Limitations Another method - Maximum Likelihood. Example.

E N D
A Short Introduction toCurve Fitting and Regressionby Brad Morantz
Overview • What can regression do for me? • Example • Model building • Error Metrics • OLS Regression • Robust Regression • Correlation • Regression Table • Limitations • Another method - Maximum Likelihood
Example • You have the mass, payload mass, and distance of a number of missiles. • You need an equation for maximum distance based upon mass of missile & payload • Regression will let you build a model, based upon these observations that will be of the form Max distance = B1 * total mass + B2 * payload mass + constant • With this equation, you can answer questions
Model Building • Why build a model? • It can help us to forecast • Can assist in design • Two ways • Causal factors • Data driven • Regression is the latter • Model based upon observations
Residual Difference between model and actual e = Y - Ŷ If we summed them, the negative and positive would cancel out If we took Absolute value, would not be differentiable about origin So we take sum of squares MSE is mean of sum of squares Plot of values Line is the model Dots are the actual MSE
RMSE • RMSE = sqrt(MSE) • If we accept that MSE is estimator of variance, then RMSE is estimator of standard deviation. • It is also a metric of how much error there is, or how well a model fits a set of data • MSE and RMSE are often used as cost functions in many mathematical operations
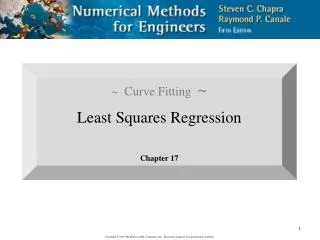
OLS Regression • Ordinary Least Squares • Yhat = B0 + B1X1 + . . . . + BnXn + e • B0 is the Y intercept • Bn is the coefficient for each variate • Xn is the variate • e is the error • The program calculates the coefficients to produce a line/model with the least amount of squared error (MSE)
Robust Regression • Based on work by Kaufmann & Rousseuw • Uses median instead of mean • Not standard practice • No automatic routines to do it • Is less affected by outliers
Simple Test of Model • Plot out the residuals • Look at this plot • Are the residuals approximately constant? • Or do you see a trend that they are growing or attenuating? (heteroscedasticity) • If it is this latter situation, the causal factors are changing and the model will need to be modified
Linear Correlation Coefficient • Shows the relationship between two variables • Positive means that they travel in the same direction • Negative means that they go in opposite directions • Like covariance, but it has no scale • Can use for comparisons • Range is from -1 to +1 • Zero means no relationship, or independent • Rxx = XTX (which becomes easy to implement in a matrix language like Fortran or Matlab)
Correlation and Dependence • If two items are correlated, then • r ≠ 0 • They are not independent • If they are independent, then • r = 0 • P(a) = P(a|b); b is of no effect on a • Need to have some theory to support above
R2 • Pearsonian correlation coefficient • Square of r, the correlation coefficient • Fraction of the variability in the system that is explained by this model • Real world is usually 10% to 70% • Adjusted R2 • Only use for model building • Penalizes for additional causal variables
Reading a Regression Table This residual plot looks acceptable About as much on top as on bottom The R Square is very good, so is the adjusted R Square This model is very explanatory The model is good as the F value is >> 3 and the significance is << than 0.05 X is a good coefficient, as it is statistically significant, but the intercept is not with a P of 0.68 and a t <3
Limitations of OLS • Built on the assumption of linear relationship • Error grows when non-linear • Can use variable transformation • Harder to interpret • Limited to one dependent variable • Limited to range of data, can not accurately interpolate out of it
Maximum Likelihood • Can calculate regression coefficients • If probability distribution of error terms is available • Calculates the minimum variance unbiased estimators • Calculates the best way to fit a mathematical model to the data • Choose the estimate for unknown population parameter which would maximize the probability of getting what we have