Download
1 / 9
90 likes | 101 Views
12.1 – Probability Distributions. Frequency Table. A frequency table is a list of outcomes in a sample space and the number of times each outcome occurs Sample: Make a frequency table of each person’s hair color in the room Blondes Black Brunettes Red Highlights. Let’s Review.

E N D
Frequency Table • A frequency table is a list of outcomes in a sample space and the number of times each outcome occurs • Sample: Make a frequency table of each person’s hair color in the room Blondes Black Brunettes Red Highlights
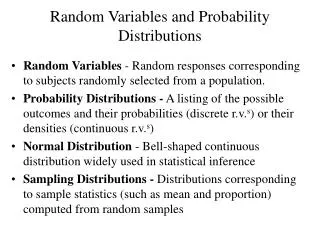
Let’s Review • What is the difference between experimental and theoretical probability? • Experimental: Finding the probability based on trials (or experiments). • Theoretical: The chances of “winning” if there are an equally likely number of outcomes.
Let’s Try Some • Kelly is competing in the Rock, Paper, Scissors Championships at the Martinez Cow Pie Festival (her eighth time competing). What is the theoretical probability of her playing a rock, paper, or scissors? 1 3 How can we determine if the theoretical probability matches the experimental?
Copy the table P1 P2
Challenge 20 people to a RPS Game (best of one game) In the table, you are player one. List the hand played when one of you wins. Circle the winning play P1 P2 Finally, determine the experimental probability of each winning play. How close is it to the experimental? How can you get the experimental to match the theoretical?
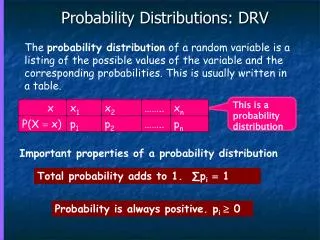
Probability Distribution • A probability distribution is a function that gives the probability of each event in a sample space. You can use a table or a graph to show the probability distribution.
Example: • You have two spinners. Each spinner has 4 possible outcomes: 1, 2, 3, or 4. Show the probability distribution for the SUM of the numbers. Find the frequency and probability. Frequency Probability
Graphing the Distributions Use a bar chart to graph the probability distribution