Download
1 / 40
400 likes | 418 Views
SPC & MSA Using Minitab. L. Goch – February 2011. Agenda. Continuous & Attribute Data IMR Charts Xbar & R Charts Xbar & S Charts MSAs Using Xbar & S Charts for MSAs Non-Destructive Variable MSAs (NOTE: Minitab will also Analyze Destructive Variable MSAs & Attribute MSAs).

E N D
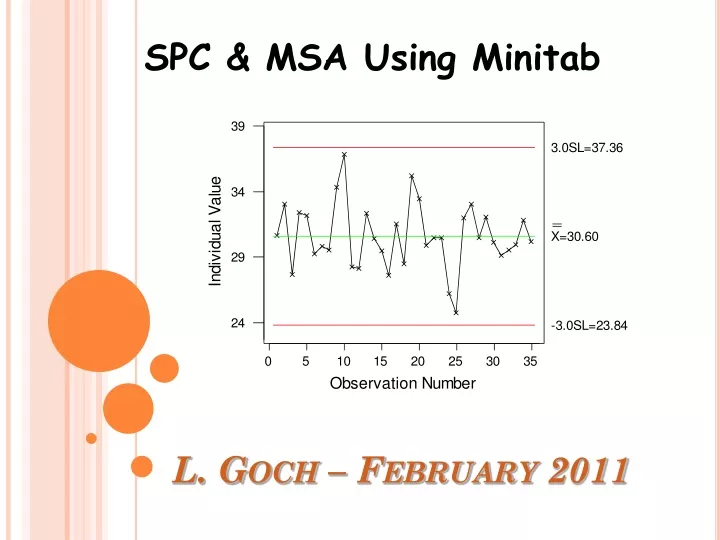
SPC & MSA Using Minitab L. Goch – February 2011
Agenda Continuous & Attribute Data • IMR Charts • Xbar & R Charts • Xbar & S Charts MSAs • Using Xbar & S Charts for MSAs • Non-Destructive Variable MSAs (NOTE: Minitab will also Analyze Destructive Variable MSAs & Attribute MSAs)
The Basic Control ChartKey Components Control Limits are NOT Spec Limits UCL Plotted Data DATA PLOTTED OVER TIME MONITORED CHARACTERISTIC Center Line LCL UCL = Upper Control Limit / LCL = Lower Control Limit
Individual-X & Moving Range Chart
Control ChartsIndividual /Moving Range • Use: • When only have 1 measurement per time period • When want to chart Counts. • When want to chart Percentages (%’s). Do NOT use P-Charts if the values are <10% or subgroup sample size >100 since it violates basic P-Chart assumptions. • Need a minimum of 10 data points • Variation • Short Term: Measures relatively rapid changes over time (Moving Range chart) • Long Term: Measures relatively gradual changes over time(Individuals chart) Charts are Based on a Subgroup Size of 1
I / MR Chart: Stat > Control Charts > I-MR • I-MR Chart analyzes individual data over time. Open worksheet Exh_QC.mtw
Minitab ExerciseIndividuals / Moving Range Output Is there a shift at Observation # 25?
Minitab ExerciseIndividuals / Moving Range Output Group Column Added
Minitab ExerciseIndividuals / Moving Range Output Press <Ctl> e
Control ChartsX Bar / R Chart • Advantages Sensitive to changes in data • Limitation Unlike the Individual Chart, the Xbar Chart control limits do not represent the overall data range. They represent the range of the subgroup averages.
Control ChartsX-bar / R Control Charts • GATHERING DATA • Define rational basis for subgrouping • Select sample size for the subgroups • Select sampling frequency • Need a minimum of 10 subgroups • VARIATION • Short Term: Measures the variation within the Subgroups based on the subgroup range (Range chart) • Long Term: Measures the variation between the Subgroups based on the subgroup average (X Bar chart)
Xbar-R Charts: Stat > Control Charts > Variables Charts for Subgroups > Xbar-R Open worksheet Camshaft.mtw
Minitab Exercise - XBar / R Charts Output What do the Charts tell us? We need to look at the individual suppliers.
Minitab Exercise - XBar / R Charts • Stack Data: • Stack the 2 Suppliers so the data can be looked at together on the same chart
Control ChartsX Bar / S Chart • Advantages • Very sensitive to changes in data. • Also, the center line of the S-Chart provides a good estimate for the data’s standard deviation. • Limitation The Xbar Chart control limits do not represent the overall data range. They represent the range of the subgroup averages.
Control ChartsX-bar / s Control Charts • GATHERING DATA • Define rational basis for subgrouping • An S-Chart is typically used when the subgroup’s sample size is > 9 • Select sampling frequency • Need a minimum of 10 subgroups • VARIATION • Short Term: Measures the variation within the Subgroups based on the subgroup stddev (S chart) • Long Term: Measures the variation between the Subgroups based on the subgroup average (X Bar chart)
Xbar-S Charts: Stat > Control Charts > Variables Charts for Subgroups > Xbar-S Open worksheet Bloodsugar.mtw
Minitab Exercise - XBar / S Charts Output What do the Charts tell us? We need to look at the individual people.
Minitab Exercise - XBar / S Charts • Sort Data: • Sort the data by SubjectID & Reading
MSA: X Bar / S Chart • Advantages • Pictorial look at MSA results • Measurement error can easily be calculated • % R&R and %P/T can easily be calculated • Daily Calibration Data can be used • Limitation • Will NOT detect measurement that varies by nominal value (e.g. large parts having more or less measurement error than small parts)
MSA: X-bar / S Chart • GATHERING DATA • Need Multiple measurements per time period • Can use 1 or more Parts • Need a minimum of 10 subgroups • VARIATION • S Chart: Displays the Measurement Error. A good measurement system will be in-control • Xbar Chart: Displays any Drift over time in the average measurements. A good measurement system will be in-control for each individual Part.
MSA: X-bar / S Chart Open worksheet Daily Calibration Data.mtw • Multiple Measurements per Day on most Days. • 1 Calibration Part per Facility • 3 Facilities • Sorted by Facility Date & Time
Xbar-S Charts: Stat > Control Charts > Variables Charts for Subgroups > Xbar-S Open worksheet Daily Calibration Data.mtw
MSA: X-bar / S Chart output Need to add the Measurement Error.
MSA: X-bar / S Chart Results • Comments • Spec is +/- 50. • %P/T target is < 30% • None of Facilities meet the measurement error target • Daily Calibration Check procedures need investigated since producing dramatically different results
Variables MSA (Non-Destructive Testing)
Variables MSA: Stat > Quality Tools> Gage Study > Gage R&R Study (Crossed) • Minimum Requirements • Minimum 10 parts: ~3 at low end of spec, ~4 parts in middle of Spec, ~3 parts at high end of spec (NOTE: some parts should be out of spec) • 3 Operators (NOTE: if only 1 operator measures parts, 1 operator may be used for MSA) • 3 Repeated Measurements
Variables MSA: Stat > Quality Tools> Gage Study > Gage R&R Study (Crossed)
Variables MSA: Stat > Quality Tools> Gage Study > Gage R&R Study (Crossed)
Variables MSA: Session Window Results Both the Part & the Operator significantly effect the part measurements. Measurement Error: +/- 0.78 (i.e. 1.55721/2 = 0.78)
SPC/MSA - Summary • The reliability of Control Charts are dependent on the selection of Rational Subgroups. Pick the wrong subgroup and the results can be very misleading. • The reliability of MSAs are dependent on the selection of the actual Parts. Pick Parts with too much or too little variation between them and the results can be very misleading.