Download
1 / 48
490 likes | 630 Views
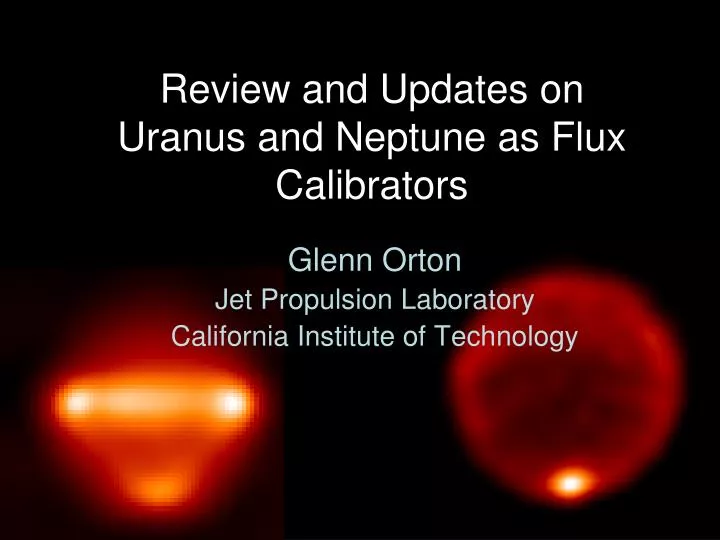
Review and Updates on Uranus and Neptune as Flux Calibrators. Glenn Orton Jet Propulsion Laboratory California Institute of Technology. Roadmap. Assessment of the Uranus model that is based on Spitzer IRS data analysis Assessment of the Neptune model that is based on ISO LWS/SWS data

E N D
Review and Updates onUranus and Neptune as Flux Calibrators Glenn Orton Jet Propulsion Laboratory California Institute of Technology
Roadmap • Assessment of the Uranus model that is based on Spitzer IRS data analysis • Assessment of the Neptune model that is based on ISO LWS/SWS data • Potential modification from Spitzer IRS data • Assessment of missing information • Bruce Swinyard’s comparison of SPIRE FTS cross-calibration of Uranus and Neptune
Current status – Uranus spectral models (more robust than for Neptune) Current (Moreno) model: based on Voyager-2 radio subsystem (RSS) occultation profile along one low-latitude atmospheric tangent, with NH3 absorption below ~300 GHz Alternative (Orton) model is based on inversion of 2007 Spitzer Infrared Spectrometer (IRS) low-resolution observation ~4 Kelvin maximum difference between the two models (maximum 5% difference in radiance prediction)
Orton et al (2012, in preparation): retrieval of disk-averaged T(p) from spectral regions controlled by well-mixed H2 collision-induced absorption (CIA) CH4 C2H2 H2 CIA C2H6 H2 S(3) quardupole H2 S(1) quardupole C4H2 C3H4 H2 CIA
Orton et al. Lindal et al. RSS T(p) (current model)
Longer wavelengths need another opacity: revisiting a conclusion from an old calibration mini-workshop: ← a model with only H2 CIA absorption is too warm Griffin and Orton (1993) Gurwell and Hofstadter, SMA data
- - - Including NH3 gas does better, with 1 ppm VMR at depth (Moreno’s suggestion) But with our derived T(p), it’s too bright for the 5-10 cm-1 (150 – 300 GHz) data, particularly the recent 1.4-mm (7 cm-1) SMA measurement
An additional opacity must be added to the model to provide a fit to the data: we tried H2S (PH3 might also work but is a less likely candidate on the basis of chemical equilibrium) - - - Lindal et al. RSS T(p) (continuum only) Gurwell & Hofstadter data (SMA, c. 2008) Sandel & Dowell data (c. 2005)
Orton et al., from Spitzer-based model T(p) Lindal et al. RSS T(p) (current standard model)
Evaluation of the model Uncertainties in the absolute calibration ±3% from measurement ±5% is Spitzer’s quoted absolute calibration uncertainty Total estimated as ±6% This propagates into an absolute temperature uncertainty that is very small: ±0.2 K This uncertainty would propagate into a submm radiance uncertainty of ±0.4%. Errors are thus more likely to arise from other systematic uncertainties or assumptions.
Did the Voyager-2 RSS sample a cold latitude? No, if anything, the near-equatorial temperatures should be warmer than the global mean.
Other possible systematic problems: • Spitzer lost flux from the IRS slit more than point sources • but correcting to add more flux makes the incompatibility worse • The H2 CIA spectrum is wrong in the 9-11 μm region • but it must be off by a factor of ~2 • The radio-occultation technique is wrong • Radio occultation approach provides only a (T/m) parameter vs. altitude • There are known problems when applied to solving for m using simultaneous mid-infrared observations • Jupiter He/H2 ratio derived from the Voyager RSS-IRIS comparison differs by substantially more than 1 standard deviation from Galileo probe results • Saturn He/H2 ratio derived from the Voyager RSS-IRIS comparison differs by a factor of two from the results obtained using IRIS spectra alone
Other possible systematic problems: • Mean molecular weight is wrong, it must be increased • add more He, but the amount required is 23%, which isn’t likely because it’s hard to add He to the ‘solar mixtures’ • add more CH4 in deep atmosphere; ~4% is required • Sromovsky et al. (2011) suggested this for independent reasons, but they also want less He than 15% to match their cloud-level constraints
Sromovsky et al. (2011) raises the mean-molecular weight by increasing the volume mixing ratio of CH4 in the deep atmosphere up to 4% from the 2.3% in the nominal RSS “best” model ---- . But they decreased the He mixing ratio in order to preserve the depth of the condensation to coincide with the depth they detect for the primary CH4 condensate cloud. This drops temperatures substantially above the CH4 condensation level. Orton et al. --- Lindal et al. nominal model
The Sromovsky et al. high CH4 abundance model lets us match the temperatures needed in the deep atmosphere, but the reduced He makes temperatures above the CH4 condensation level much too low. We can’t fit the continuum higher up.
If we ignore the Sromovsky et al. cloud-level requirement and just use the 4% “upper limit” model in Lindal et al.’s original set of possible solutions, we can match the temperature required at depth without changing the He:H2 ratio - - - - original RSS, 2.3% max. CH4 - - - - RSS, 4% max. CH4
- - - - original RSS, 2.3% max. CH4 - - - - RSS, 4% max. CH4
We can explore various assumptions about the He abundance. Orton et al., from Spitzer-based model T(p) 15% He / 85% H2 - - - - - 12% He / 88% H2 - - - - - 18% He / 82% H2 Lindal et al. RSS T(p) 15% He / 85% H2 (2.3% CH4)
The mid-infrared spectrum is very sensitive to the He/H2 ratio. Orton et al., from Spitzer-based model T(p) 15% He / 85% H2 - - - - - 12% He / 88% H2 - - - - - 18% He / 82% H2 Lindal et al. RSS T(p) 15% He / 85% H2 (2.3% CH4)
The nominal model does extremely well using the Voyager He/H2 ratio. The spectrum is really consistent with (internal, unpublished) ISO observations. (LWS data were calibrated to Mars, SWS to a suite of calibrators.) Orton et al., from Spitzer-based model T(p) 15% He / 85% H2 - - - - - 12% He / 88% H2 - - - - - 18% He / 82% H2 ISO LWS ISO SWS - - - Lindal et al. RSS T(p) 15% He / 85% H2 H2 S(0) H2 S(1)
Plans: Uranus spectrum in 17-37 μm region will be proposed for SOFIA FORCAST grism spectroscopy.* These will extend the Spitzer IRS spectrum. ISO LWS ISO SWS H2 S(0) H2 S(1) *Cycle-1 proposals are due in one week! :-0
Uranus model assessment • What’s good: • Fits the Spitzer IRS data • Characterizes the whole disk • Matches ISO data with standard He/H2 ratio • Better match to SPIRE FTS results relative to Neptune (explained below) • Close to Voyager-2 IRIS disk-averaged results (requires more work: translate pole-on to near equinoctial orientation) • What’s not so good: • Does not match a ‘nominal’ Voyager RSS profile without a ‘fix’, such as moving 2.3% CH4 to ~4% CH4 • Requires an additional millimeter opacity (H2S ?) [testable] • Damn thing ain’t published! • Time variability • Longitudinal variability expect to be low • Seasonal variability can be assessed
ISO Heritage: LWS and SWS studies of Neptune: application to FIRST Herschel (Burgdorf et al. 2003) LWS ground-based: IRTF (Orton et al. 1989, 1990) SWS calibration based on the Griffin & Orton “standard model” for Uranus
T(p) modelsfor Neptune Herschel PACS (Lellouch et al. 2010; basis of ESA3) Spitzer IRS (Line et al. 2008) ISO + ground-based (Burgdorf et al. 2003) Akari (Fletcher et al. 2010) Voyager RSS - - - (Lindal et al. 1990)
Neptune Burgdorf et al. (2003) LWS SWS IRTF
Limited constraints from Spitzer IRS Neptune Spitzer IRS: Short-Low-1 (SL1) (photometrically accurate) no continuum LWS SWS IRTF
Spitzer IRS SL1 (photometric) Spitzer IRS SH (scaled to SL1) Neptune Burgdorf et al. (2003) LWS SWS IRTF
Spitzer IRS SL1 (photometric) Spitzer IRS SH (scaled to SL1) Neptune Burgdorf et al. (2003) LWS SWS IRTF (scaled up by 28%)
Spitzer IRS SL1 (photometric) Spitzer IRS SH (scaled to SL1) Neptune Burgdorf et al. (2003) Lellouch et al. (2010) / ESA3 Incomplete fit to combination of ISO and Spitzer data (2012)* *last Tuesday! LWS SWS IRTF (scaled up by 28%)
Spitzer IRS SL1 (photometric) Spitzer IRS SH (scaled to SL1) Neptune Burgdorf et al. (2003) Lellouch et al. (2010) Incomplete fit to combination of ISO and Spitzer data (2012) SOFIA “Basic Science” FORCAST results (3 weeks ago): pipeline calibration
Spitzer IRS SL1 (photometric) Spitzer IRS SH (scaled to SL1) Neptune Burgdorf et al. (2003) Lellouch et al. (2010) Incomplete fit to combination of ISO and Spitzer data (2012) SOFIA “Basic Science” FORCAST results: default calibration SOFIA “Basic Science” FORCAST results: pipeline calibration
Neptune (H2 CIA continuum models only) • Burgdorf et al. (2003) • Lellouch et al. (2010 / ESA3) • Incomplete fit to combination of • ISO and Spitzer data (2012)* • Griffin & Orton (1993) • *last Tuesday
Neptune models- assessment • The a priori basis for Fletcher et al., and, indirectly, Lellouch et al. models is some perturbation of Voyager RSS results and ISO results (Burgdorf). • Unlike Uranus, there are no direct constraints on temperatures in the relevant part of the atmosphere. Herschel (e.g. SPIRE) may provide those constraints, or independent measurements at longer wavelengths. • Seasonal variability is tiny in the Herschel time frame. The short-term tropospheric variability is likely to be low on a hemispheric average, but it’s actually unknown.
Bruce Swinyard’s SPIRE FTS Uranus vs Neptune comparison • Use HIPE v8 with a bolometer temperature conversion stage to generate averaged interferograms. This now includes the proper phase correction and everything up to the generation of the interferogram is the standard SPIRE processing. • Check the interferograms for proper phase correction (it works very well now). • Process the on source and darks of the day separately and subtract and calibrate using a telescope model. This is based on a combination of modified versions of the instrument throughput and telescope emissivity versus wavenumber – as described below. • The generated spectrum is compared to the Uranus model provided in brightness temperature by Glenn Orton on 14/2/2011 and one in Jy for OD423 by Raphael Moreno in December 2010. In all that follows here I have adjusted everything to fit the Orton Model. • Note the Uranus observation used is the one taken on OD423 (10/07/2010 commencing 19:36:46). For this date Horizons gives the Delta as 19.77 AU
Uranus, Neptune SPIRE FTS results & absolute calibration • The best calibration approach has been to use the telescope emissivity itself • We observe the whole of the telescope – therefore use mean of the thermistors on each mirror to construct model of telescope emission
Original telescope emissivity function (Fischer et al.) Telescope emissivity function model modified to fit the GO Uranus model: - The change is small and well within the error bars of the original function.
Uranus spectrum GO model RM model Spectrum/Model ratio
Derived Uranus spectrum GO model RM model x Sandel & Dowell
Derived Neptune spectrum GO Neptune model (Burgdorf et al. 2003) RM model (Lellouch et al 2010 / ESA3) Using the Spitzer (“GO”) Uranus model mode. produces self-consistent spectra of Neptune.
Neptune: observed spectrum / model ratios RM (Lellouch et al.) / ESA 3 model GO (Burgdorf et al. 2003) model
Conclusions (Swinyard) • Using the Orton (Spitzer-based) spectral model for Uranus provides a calibration for the Neptune model that provides a reasonable agreement with ESA3 and “GO”. • It is better than the current Uranus model + 10 Jy used in the SPIRE pipeline and should be adopted immediately. • Glenn’s comment: more work should be done on the Neptune models. They both seem too dim by 3-5%.
But we must be careful in making such comparisons. There is a big change in the projected geometry over decades. In 1986, Voyager IRIS observed the whole disk of the planet pole-on; in 2010-2012 we’re just past equinox. 1999 2004 HST: enhanced R, G, B Keck AO: enhanced J, H, K (Karkoschka, press release) (de Pater and Hammel, press release)
There is also genuine change in time whose influence we have to evaluate on the disk-averaged spectrum – the north polar region has cooled. VLT/VISIR 18-μm images of Uranus 1,2 Sept 2006 • North pole should be warm, but • it has cooled since 1986. How • deep are these differences? • - Assess using 19-21 μm • imaging, sensing deeper Uranus obs. deconvolved IRIS-based simulation
Spitzer IRS Spectrum of Neptune CH4 C2H6 Note minimal region where H2 CIA spectrum is available in SL spectrum CH3D Not much of spectrum is useful to constrain the global-mean T(p), but an attempt was made by student, Mike Line (2008). C2H2
Examine He sensitivity Best fit for He VMR: 7.1-11.5% *15% He 10% He
Uncertainties in the bulk composition are based on those of Voyager for mixing ratios of H2 , He ~ ±0.033 Biggest uncertainty is in far infrared: ±3% at 100 cm-1/100 μm, ±6% at 175 cm-1/ 57 μm Negligible influence at the longest wavelengths/ shortest frequencies. Para-/ortho-H2 uncertainty propagates an uncertainty in the spectral radiance that is very small. Mitigation of compositional uncertainty: SOFIA Cycle-1 proposal to constrain He/H2 ratio with 19-37 μm photometry and spectroscopy using FORCAST instrument.
Current status – Neptune spectral models Current model: based on Lellouch et al. (2010) fit to HD lines via perturbation of Akari mid-infrared spectrum for the stratosphere (Fletcher et al. 2010) and earlier model (Martin ?) Alternative model is based on ISO LWS/SWS data (Burgdorf et al. 2003), preliminary fit to Spitzer IRS data (Line et al. 2010, DPS), and ground-based spectrum (Orton et al. 1090) ~X Kelvin maximum difference between the two models (maximum Y% difference in radiance prediction)