Download
1 / 12
120 likes | 220 Views
Shantanu Desai Penn. State University Scimon Camp, Livingston, LA August 18, 2006. THE EVENT DISPLAY TOOL. Outline of Talk. Introduction to Event Display and History Median-normalized spectrogram Example of Event display for a H1-H2 double coincidence

E N D
Shantanu Desai Penn. State University Scimon Camp, Livingston, LA August 18, 2006 THE EVENT DISPLAY TOOL
Outline of Talk • Introduction to Event Display and History • Median-normalized spectrogram • Example of Event display for a H1-H2 double coincidence Kleine-Welle event with significance > 35 http://ldas-jobs.ligo.caltech.edu/~desai/event_838412223.html • Examples of known glitches and environmental artifacts (Rai’s question at plenary meeting on “database” of events) This talk will not go into any software details or intricacies in running the event display tool. This can be discussed offline
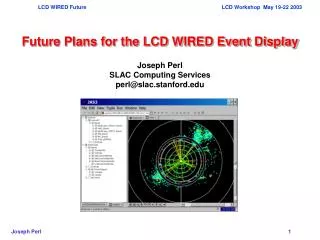
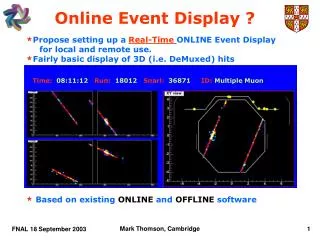
INTRODUCTION • Event display is a web-based tool which produces time-series and median normalized spectrograms within ± 0.2 and 4 sec. for a fixed set of channels at any given time of interest along with some other supplementary information. • First developed and implemented by K. Rawlins(MIT) with contributions by Shourov , Michele and others from Burst group at MIT. • Useful to spot glitches in DARM-ERR and auxiliary channels. • Supplements Shourov's Q-scan tool (next talk). Q-scan much better at spotting low-amplitude glitches. • It has been extensively used by glitch group to look at outlier events from loud burst and inspiral triggers since S4. • Since S5, also been used to look at HW injections, GRB events etc
Median-Normalized Spectra • Difference between regular and median-normalized spectrogram (introduced by Gaby) Median-Normalized Spectrogram Normal Spectrogram LSC-DARM_CTRL_EXC_DAQ • Also applies Linear Predictive Error Filter to time-series for almost all the channels (written by Shourov) (DARM-ERR exists with and without LPEF)
USES AND LIMITATIONS • Gives a nice summary and overview of what is happening in the detectors and environmental channels. • Proved useful in S5 for spotting problems and creating DQ flags. • Not a substitute for any quantitative analysis for the above • One could get fooled by some of the filtering effects used in the event display (LPEF). • Unable to spot glitches outside specified frequency range. • For events near lock-loss you have to be careful about “cause and effect” while looking at PEM channels. • For environmental channels , only plots raw ADC counts and not calibrated spectra
Extra channels • Stand-alone script exists which produced same types of time-series and/or spectrograms for any channels in L1 RDS or raw frame and in any frequency range which may not be in regular event display. ISS channels (present only in raw frames) :
KNOWN GLITCHES • Stuck “awg” Single-sample calibration line dropout • Such calibration line glitches always cause large amplitude glitches in DARM-ERR
KNOWN GLITCHES • Dips in DC level in light cavity. LSC-DARM_ERR ASC-QPDX_DC • P. Shawhan creating DQ flags for such intervals.
SOLVED GLITCHES • Switching to ASPD5 Fixed by adding LSC-AS_TRIGL channels
AIRPLANE EVENTS • S-shaped or line with non-zero slope in the microphone spectrograms
SEISMIC • Example of Seismic up-conversion DARM-ERR/AS-Q • Many such events seen in LHO. Now possible to identify them without even looking at the seismic channels.
CONCLUSIONS • Event display tool (along with Q-scan) can be used to find glitches. • Codes are mainly written in matlab with perl and shell scripts as drivers. All of them are in matapps under src/utilities/event_display/ • If you want to run ED at any time or want to install it or replace any set of channels with some different ones, please let me know. • Under development : a CGI based interface to the event display tool. • Working on a raw channel event display to track down unknown glitches. • Create a similar event display for GEO