Download
1 / 16
320 likes | 836 Views
Response to Selection. Bio 508: Evolution Robert Page Slides Courtesy of Dr. Voss. Heritability. h 2 = V A /V p. Proportion of total phenotypic variance attributable to additive genetic variance . Describes the extent to which offspring resemble their parents.

E N D
Response to Selection Bio 508: Evolution Robert Page Slides Courtesy of Dr. Voss
Heritability h2 = VA/Vp Proportion of total phenotypic variance attributable to additive genetic variance Describes the extent to which offspring resemble their parents
heritability (narrow sense): VA VP h2 = h2 = bOP Detecting the genetic component of phenotypic variation Drosophila wing length Resemblance between parents and offspring indicates degree to which a trait is inherited Offspring average (O) bOP parental average (P) Fraction of variation in parents that is explained by variation in their genes (VA).
Bill depth in the Ground Finch 1976 h2 = 0.9 1978
Heritability is often measured in the lab; estimates are higher than would be expected in nature. Almost all characteristics in almost all species are genetically variable to some extent.
Detecting the genetic component of phenotypic variation Genetically variable characters can be altered by selection. The response to selection is proportional to the amount of genetic variation in the character.
Truncation Selection 68% Breed only these 16% 14% 14% Standard deviation units S = selection differential
Response to selection when bOP = 1 selected nonselected 16% > 1 Note standard deviation ( = 2 cm
Response to selection for a less variable population Note standard deviation ( = 1 cm
Response to selection under a more intense selection program 2% > 2
Summary of Graphs Response of a quantitative trait to selection depends on: the relationship between fitness and phenotype the phenotypic variance the degree to which the trait is heritable R = h2 S
generation h2 (low line) 1–9 0.50 10–25 0.23 26–52 0.10 53–76 0.15 Selection on polygenic characters How do selection response and heritability change over time? R = h2S • Long-term selection may eventually exhaust standing additive genetic variation • Continued response depends on mutational input
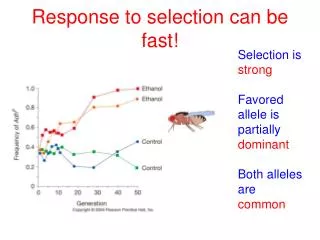
Response to Selection for Increased Bristle # 316% increase in phenotype !