Download
1 / 31
310 likes | 445 Views
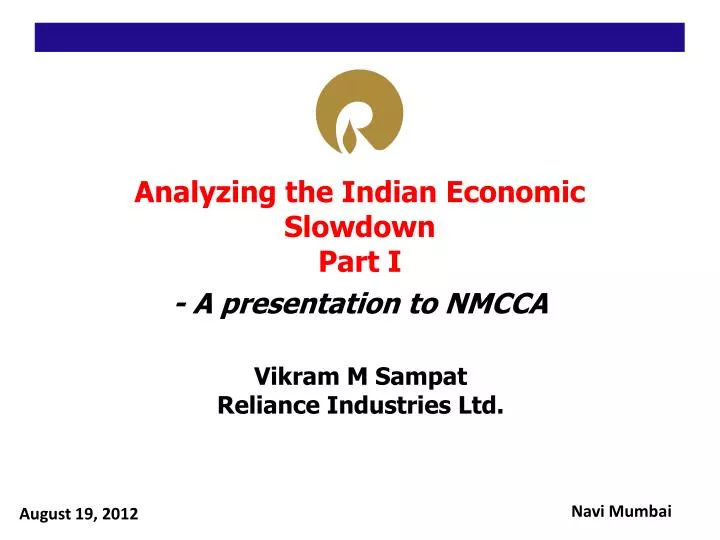
Analyzing the Indian Economic Slowdown Part I. - A presentation to NMCCA. Vikram M Sampat Reliance Industries Ltd. Navi Mumbai. August 19, 2012. Analyzing the Indian Economic S lowdown. Background Advantage India….. Areas for improvement….. Conclusions . Background.

E N D
Analyzing the Indian Economic SlowdownPart I - A presentation to NMCCA Vikram M Sampat Reliance Industries Ltd. Navi Mumbai August 19, 2012
Analyzing the Indian Economic Slowdown • Background • Advantage India….. • Areas for improvement….. • Conclusions
Background • What is a slowdown? • India – Historic GDP growth trends • Global perspective • Current trends
What is slowdown? • Significant reduction in rate of GDP growth • GDP growth remains positive • Slowdown is not a recession • Employment and productivity may decline Is India experiencing a slowdown?
Indian slowdown? • Falling GDP growth – 5.3% is the lowest rate in 7 years Indian economy : Believed to be in slowdown
India – Historic GDP trends • 4 phases of economic growth identified • First 3 phases relate to socialist India • Period up to 1970s characterized by Hindu rate of growth • Economic liberalization post 1985 brought about a shift in economic growth Phase 4 Phase 3 Phase 1 Phase 2 Source: www.rbi.org, AravindPanagaria Significant growth impetus post 1988
1988 – 2011 : Economic performance • Liberalization started by Rajiv Gandhi & NarsimhaRaoGovts. • GDP growth broke past trends post 1988 • 2003-2008 : Highlight years with highest growth • Widely believed to be a new level of growth • Growth has slowed down marginally since then Source: www.rbi.org, AravindPanagaria Was 2003-08 a break from trend or a new trend?
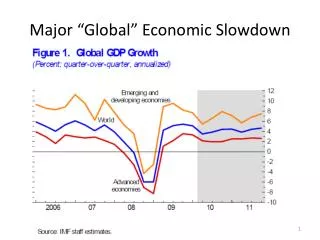
Global Perspective - GDP trends • Strong global economy over 20 years. • Robust economic growth • Low inflation rate • Low real interest rate • Past 5 years have seen exceptional growth • US has witnessed stable growth • Falling growth rate in Euro area • Strong performance from Asia 2003-08 - A golden period
US Unemployment – Jobless recovery Unemployment rate, % Technology boom Source: Bureau of Labor Statistics • Despite strong performance, jobs return slowly Unemployment – A structural problem?
Population Profile • US has moved to a developed market age profile
Trouble makers : Interest rates • Loose monetary policy for too long after 2001 recession • US Fed was the big culprit with one year at 1% • Allowed excessive liquidity build-up through borrowings • US monetary policy tightening was very sluggish between 2004-06 Source: Tuatara Management Limited, 4 July 2008 • Policy decision to maintain low interest rates…..
Trouble makers :US savings • Was the US consuming too much? Source: US Dept of Commerce • So was the developed world • … led to unusually high consumption in developed world
Trouble makers :US reserves • Excessive US current account deficits • US Financing itself through emerging market reserves • … with excessive reliance on deficits and borrowings
Assets securitization • CDOs used to keep exposures off balance sheets • Greatly enhanced secondary markets for loans • Provided 20-30% of Inv. banks profits before the meltdown • Banks and rating agencies failed to adequately scrutinize borrowers but escaped responsibility for defaults • … and “innovative” financing to keep the show going
Derivatives - CDS Measures health of CDS dealers • Started as an insurance • At peak volume outstanding of $62 trillion, CDS volumes much higher than underlying bonds issues • Cos like AIG wrote far too many contracts. Lehman party to 7-10% of market trades, increasing risk index and catalyzing banking busts • Not settled through exchange – posed severe counter – party risks • All this was a combustible mixture!!
Stock markets • Global equity markets witnessed record growth • Equity Valuations reached a record high
Commodity prices • Investors turned to commodities in search of high returns and catalyzed record high commodity prices • Commodity markets could not sustain the pressure • Rapidly rising commodity prices stoked inflation across the board • Greed got the better of the system
Inflation triggers • Growing consumption demand led to steep rise in food and non-food inflation • Inflation which was earlier contained due to aggressive manufacturing by Asia/China, could no longer be controlled once commodity, house and food prices shot up • Rising prices for food and commodities triggered inflation
Inflation • High commodity prices kicked in inflation in developed and emerging markets • Food, housing and commodity boom triggered inflation
Trigger for sub-prime • Rising inflation • Hike in the interest rates Source: Tuatara Management Limited, 4 July 2008 • Break-down of loan-consumption cycle
Impact on the equity markets (Worlds Equity Market Cap) • Credit Crunch leads to withdrawal of funds from equity markets, leading to a drastic fall in indices • Fall in overall consumer demand further leads to fall in the stocks
India – Following Global Trends • Indian and China following global GDP trends • Slowing growth in US & EU have impacted exports • Slowdown : A fallout from global trends?
Global overview - Summary • Indian economic boom during 2003-08 coincided with and was helped by the global economy boom • Bust in 2008 has been followed by severe crisis, which is still continuing in Europe • Indian economy has been impacted due to the bust. • Indian growth has returned to pre-boom period performance • Indian economy increasingly linked to global economy India mirroring global cycles
India - Current GDP Trends • Significant reduction in GDP • Contraction in manufacturing • Slower growth in services • Slowdown in investment • Other concerns • Bludgeoning fiscal deficit • High inflation • Rupee depreciation • European crisis • India – On the edge
Advantage India….. • Economy • Liberal Society • Democracy • Demography
Economy – Size & potential • Large and growing economy • Growth driven by internal consumption • Liberalized industry & financial system
India – Robust GDP growth • Second fastest growth rate consistently in large economies • Stable growth • World’s largest democracy with advanced (but slow) legal structure
Savings & Investment • High savings and investment rates • Supported by sophisticated financial markets • ICOR-4 Thus savings can support 8% GDP growth • Savings to support investments
GDP Structure - Drivers • GDP led by services based on: • Strong IT infrastructure • English speaking population • Young population & favourable demographics • Strong education systems • GDP structure driven by educated populace and free society
FII inflows • Favoured FII destination
Demography & demographics dividend • Only 5.5% of population over 65 years • Median age – 26 years : over 52% below 25 years • By 2030, around 62 – 63% of Indian population will be in working age with lowest dependency ratio • Large and growing middle class • Demographics are not destiny