Download
1 / 8
80 likes | 169 Views
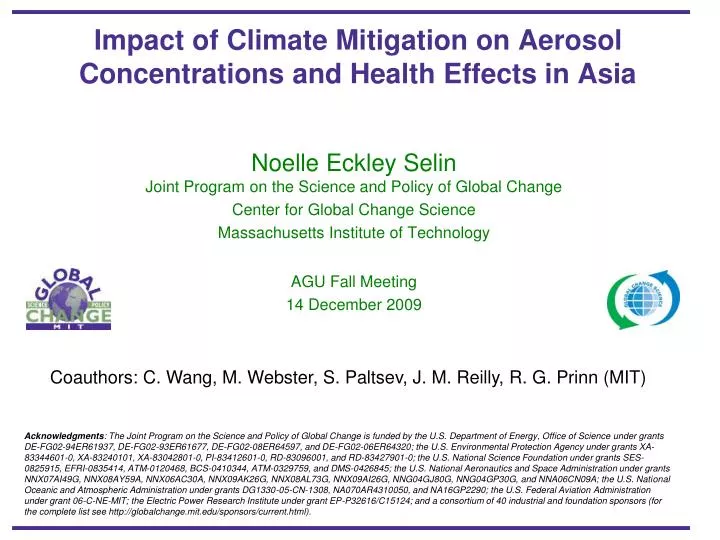
Impact of Climate Mitigation on Aerosol Concentrations and Health Effects in Asia. Noelle Eckley Selin Joint Program on the Science and Policy of Global Change Center for Global Change Science Massachusetts Institute of Technology AGU Fall Meeting 14 December 2009.

E N D
Impact of Climate Mitigation on Aerosol Concentrations and Health Effects in Asia Noelle Eckley SelinJoint Program on the Science and Policy of Global Change Center for Global Change Science Massachusetts Institute of Technology AGU Fall Meeting 14 December 2009 Coauthors:C. Wang, M. Webster, S. Paltsev, J. M. Reilly, R. G. Prinn (MIT) Acknowledgments: The Joint Program on the Science and Policy of Global Change is funded by the U.S. Department of Energy, Office of Science under grants DE-FG02-94ER61937, DE-FG02-93ER61677, DE-FG02-08ER64597, and DE-FG02-06ER64320; the U.S. Environmental Protection Agency under grants XA-83344601-0, XA-83240101, XA-83042801-0, PI-83412601-0, RD-83096001, and RD-83427901-0; the U.S. National Science Foundation under grants SES-0825915, EFRI-0835414, ATM-0120468, BCS-0410344, ATM-0329759, and DMS-0426845; the U.S. National Aeronautics and Space Administration under grants NNX07AI49G, NNX08AY59A, NNX06AC30A, NNX09AK26G, NNX08AL73G, NNX09AI26G, NNG04GJ80G, NNG04GP30G, and NNA06CN09A; the U.S. National Oceanic and Atmospheric Administration under grants DG1330-05-CN-1308, NA070AR4310050, and NA16GP2290; the U.S. Federal Aviation Administration under grant 06-C-NE-MIT; the Electric Power Research Institute under grant EP-P32616/C15124; and a consortium of 40 industrial and foundation sponsors (for the complete list see http://globalchange.mit.edu/sponsors/current.html).
How does climate policy influence air pollution? Objective: Use results from the MIT IGSM climate uncertainty ensemble to quantify co-benefits of climate policy for aerosol health impacts and associated economic valuation. • Model framework • Climate policy case description [MIT Integrated Global System Model: Sokolov et al., 2005, 2009; Webster et al., 2009]
Climate Policy Scenarios and Simulations MIT IGSM ensemble examines global climate stabilization policies and associated uncertainties (U.S. CCSP 2007) Level 4≈750 ppm Level 3≈650 ppm Level 2≈550 ppm Level 1≈450 ppm [Webster et al., 2009] Climate policies are prescribed, but air pollution policies are endogenous (parameterized similarly across climate policy scenarios). Thus, we can test “co-benefits” of climate policy.
Assessing PM2.5 in the IGSM framework Climate Policy Scenarios (Level 1-4 stabilization) Lat-Lon distributions of PM2.5 components from MIT-NCAR CAM3 (3D) Population distribution Ratio of BC, OC and SO4= aerosol changes from IGSM (2D) for each latitude band (2050/2000) Latitude Population-weighted PM2.5 estimates for China, India and associated uncertainty distribution Concentration
Uncertainties in PM2.5 changes Level 4 Level 3 Level 2 Level 1 Error bars refer to +/- 1 standard deviation of 400-member ensemble
PM2.5 with and without climate policy Population-weighted annual average PM2.5 change due to climate policy (Level 1: ≈450 ppm): India: -2.9 μg m-3 China: -7.0 μg m-3
MIT EPPA Health Effects Model Emissions Prediction and Policy Analysis model: general equilibrium economic model Concentration of PM2.5 (data, model): Population-weighted concentration per global region (16 regions) Morbidity and mortality outcomes and costs (EU Extern-E, 2005) Units for E-R functions: cases yr-1 person μg-1 m3, except for mortality (Δ annual mortality rate μg-1 m3). Costs are per case. Loss of labor, leisure, capital and equilibrium economic effects (2000-2050) [More info on EPPA-HE: Matus et al., Climatic Change, 2008; Selin et al., ERL, in press]
Economic impacts Difference in economic welfare due to PM2.5 morbidity and mortality between Level 1 (450 ppm) climate policy and no policy is ≈$130 billion in China and India together (in year 2000 US$) For comparison, Global % GDP cost of climate policies (2060) range from 0.4%-6.7% for different policies Future work: Assess health benefits of targeted emissions reductions; produce global estimates of health costs from air pollution Climate policy costs from U.S. Climate Change Science Program, 2007 using IGSM