Download
1 / 43
460 likes | 603 Views
ECOSYSTEM ECOLOGY. … the integrated study of biotic and abiotic components of ecosystems and their interactions. To achieve this integration: follow the path of matter and energy. Divides ecosystems into stores and fluxes. A focus on material exchanges, instead of numbers of individuals:.

E N D
ECOSYSTEM ECOLOGY … the integrated study of biotic and abiotic components of ecosystems and their interactions. To achieve this integration: follow the path of matter and energy. Divides ecosystems into stores and fluxes.
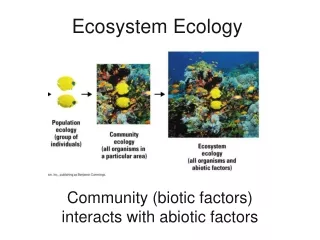
A focus on material exchanges, instead of numbers of individuals: death renewable resources reproduction C in soil a population C (e.g. in forage) C (e.g. in grazers) C in atmosphere N in soil N (e.g. in grazers) N (e.g. in forage) N in atmosphere
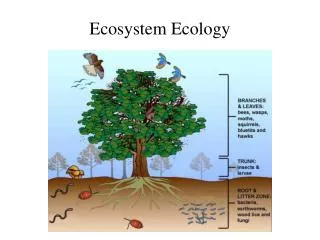
O2 release CO2 uptake Absorbs light water vapor release More live biomass Soil nutrient uptake: N,P,S,K,… litter root exudates (complex sugars, allelochemicals?, leached N Water uptake Matter fluxes through a typical primary producer:
C, N, H2O, etc. in urine O2 of air intake C, N, H2O, etc. in dung C, N, H2O, etc. in grass C, N, H2O, etc. in milk CO2 of air expelled C, N, H2O, etc. in a calf Methane, CO2 C, N, H2O, etc. in the dead cow Matter fluxes through a typical primary consumer:
TASKS OF ECOSYSTEM MODELS Identify energetic constraints on material exchanges (by quantifying primary productivity) Close material budgets Represent all major pools of materials in an ecosystem, exchange of materials between them, and linkages that may exist between the flow and storage of different materials (= ecosystem stoichiometry)
Population models: • Good at capturing constraints that act at the level of the individual (e.g. reproductive problems associated with low population numbers, chance events, genetic change, behavior) . • Bad at capturing environmental constraints (available energy, mass balance, climate impacts). • Risk of violating environmental constraints by an abstraction too far removed from biochemical mechanisms. • Ecosystem models: • Good at characterizing the physical/biochemical constraints on growth. • Bad at representing complexities based on the interaction of individuals. • Risk of oversimplifying population processes by reducing dynamics to the exchange of materials.
THE NATURE OF THE ENERGETIC CONSTRAINT IN ECOSYSTEMS H2O H2O C,N,P etc. C,N,P
Coupled energy and water balance for terrestrial surfaces: Surface Energy Balance Equation: RnetNet radiation: the difference between incoming and outgoing radiation. H Sensible (convective) heat flux: energy exchange between the surface and the atmosphere through temperature change of air. LE Latent heat flux (evapotranspiration): energy exchange between the surface and the atmosphere through phase change of water (evaporation, condensation, melting, sublimation, etc). G Ground heat flux: energy exchange between the surface and the ground. DS Stored heat in vegetation Water Balance Equation: P Precipitation inputs DS Changes in ecosystem water storage E Evapotranspiration R Runoff
Energy flow through living organisms are coupled to the flow of carbon:
The rate of plant respiration per unit area (Rp) Net Primary Production (NPP) Net carbon gain in biomass (= total carbon absorbed by plants (GPP) – carbon released by plant respiration Rp) The rate of carbon fixation per unit area: Gross Primary Production (GPP) Net Primary Production into the trophic web
Globally, NPP is primarily controlled by precipitation and temperature:
The rate of carbon/energy fixation: Gross Primary Productivity (GPP) Net Ecosystem Exchange (NEE) = Carbon absorbed or released by the entire ecosystem (GPP – ecosystem respiration) The rate of ecosystem respiration (RP+Rs) Net Ecosystem Exchange This is the carbon that stays in the ecosystem.
The rate of carbon/energy fixation: Gross Primary Productivity (GPP) Net Ecosystem Exchange (NEE) = Carbon absorbed or released by the entire ecosystem (GPP – ecosystem respiration) The rate of ecosystem respiration (RP+Rs) Net Ecosystem Exchange This is the carbon that comes out of the ecosystem.
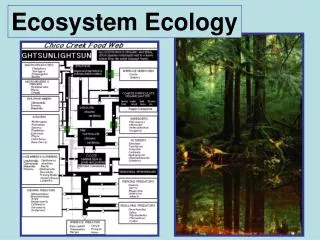
Carbon (energy) flow through the trophic web: Carnivores II CO2 CO2 CO2 CO2 ≈10% Carnivores I Soil food chain (detritus eaters, decomposers) Detritus, Faces, Urine ≈10% Herbivores ≈10% Primary Producers
Since all food chains are “fed” by plant biomass, a major effort of ecosystem models is the representation of primary production and its dependence on climate factors.
Light & CO2 limitation of photosynthesis at the leaf level
Maximal photosynthetic rates are temperature dependent Gurevitch, Scheiner and Fox 2002
PAR TAIR Stomatal conductance is regulated by many atmospheric, and some internal factors: VPD Y PCO2 Jarvis 1976
The primary productivity of ecosystems is modeled as the interchange of leaf-level photosynthesis and respiration, soil respiration and the exchange of energy and carbon within the canopy and across the canopy boundary.
To integrate primary production into the trophic web, allocation of carbon in plants also has to be made explicit: flowers seeds stems roots leaves
An ocean foodweb: Cod Food Web, David Lavigne
The number of trophic levels appears to be highly conserved across ecosystems. Mean net primary productivity: 5-100 g m-2 yr-1 Mean net primary productivity: 1200 g m-2 yr-1
Most food chains have four trophic levels or less. Schoener 1989
Insect webs tend to be more complex (longer and more connected). Schoenly 1989
Species diversity declines with increasing trophic levels. Schoenly et al. 1991
Why are so many food chains short? • Food chains run out of energy to support viable population sizes at higher trophic levels? • There could be longer food chains, but area in each of earth’s ecosystems is too small to support another trophic level? • Long food chains are more unstable (Pimm and Lawton 1977)?
What makes a food chain complex? • Length of the longest trophic chain • Number of species in the web • Number of connections between species
Measure of stability: • Dynamic stability: the tendency to return to equilibrium after perturbation (eq. is stable or unstable). • Resilience: how fast variables return to the equilibrium after perturbation (e.g. determine the eigenvalues of linearized system) • Resistence: the degree to which a variable is changed after perturbation. • Persistence of the species assemblage: the degree to which the suite species remains the same (no species loss, no invasion). • Variability: the degree to which variables change over time. • Most stability measures are sensitive to the magnitude and nature of perturbation and the time of observation.
Robert May’s approach (1972): • Construct a (linear) community matrix of m species that, each on their own would return to equilibrium (e.g. by negative density dependence). • Randomly switch on interactions between species (add positive or negative interaction parameters to the community matrix outside the diagonal), subject to the constraints: • pick C = web connectance, the probability that any pair will interact. • pick s = mean interaction strength • Determine the probability P of drawing a stable community matrix, where (by definition) all eigenvalues have a negative real part.
Robert May’s approach (1972): • A stable outcome is favored by • weak interactions (s) • few species (m) • weak connectivity (C) • Other conclusions: • species that interact with many species should only weakly interact with them. • m species whose interactions are clustered into independent blocks of strong interactions have a higher chance of stability that m species all connected by weak interactions.
Increasing tendency to return to equilibrium after perturbation Pimm and Lawton’s approach: Pimm and Lawton compared the resilience of random food chains with different trophic levels:
Increasing tendency to return to equilibrium after perturbation Webs containing omnivores are generally less stable. Decreasing tendency\ to return to equilibrium
To examine the properties of actual food webs, Pimm (1980) collected information on natural food webs, and then randomized trophic relationships.
p1: probability of a random food web having fewer of the same no of trophic levels. p2: probability of a random food web having fewer of the same no of omnivores.
Summary of modeling predictions: • The more species are present in a community: • the less connected the species should be; • the less resilient its populations; • the greater the impact of species removal; • the longer the persistence of species if no species removal. • The more connected a community: • the fewer species there should be; • the greater the impact of species removal; • the more resilient its populations; • the more persistent its composition; • the longer the persistence of species if no species removal.
Summary • Ecosystem models emphasize the concept of matter cycling and mass balance. • Terrestrial models usually dominated by plants, herbivores and soil microbial processes: matter cycling through higher trophic levels often adds little to overall ecosystem dynamics. • Ecosystem models are probably the most important avenue for investigating the potential effects of climate change (as well as predicting climate change itself). • The current research direction goes towards the greater integration of individual-based and ecosystem approaches.