Download
1 / 21
570 likes | 1.57k Views
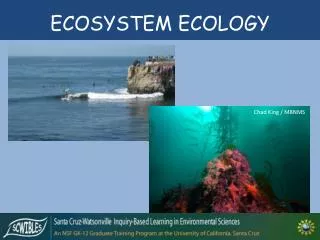
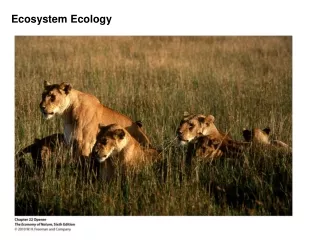
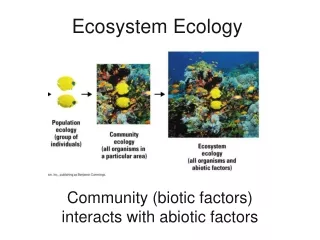
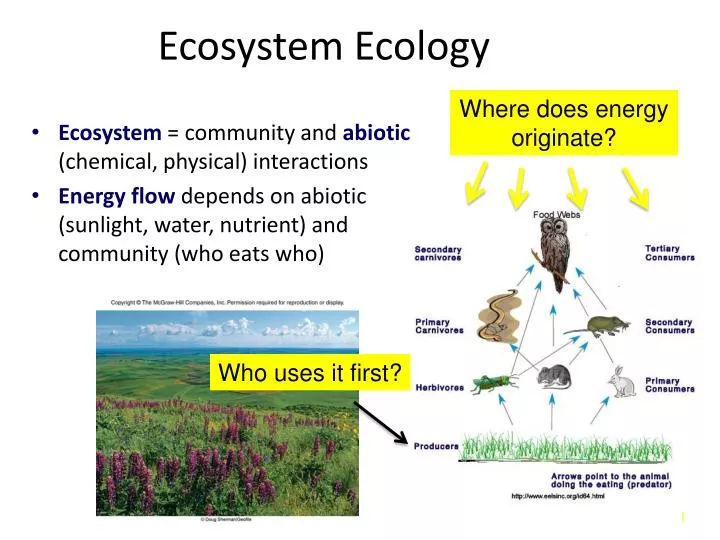
Ecosystem Ecology. Where does energy originate?. Ecosystem = community and abiotic (chemical, physical) interactions Energy flow depends on abiotic (sunlight, water, nutrient) and community (who eats who). Who uses it first?. Energy Flow through Ecosystems.

E N D
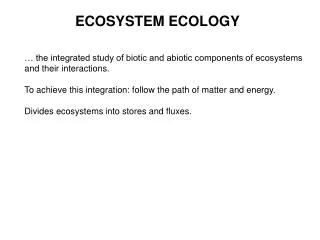
Ecosystem Ecology Where does energy originate? • Ecosystem = community and abiotic (chemical, physical) interactions • Energy flow depends on abiotic (sunlight, water, nutrient) and community (who eats who) Who uses it first?
Energy Flow through Ecosystems • Primary production: Energy absorbed (fixed) by producers (autotrophs) in ecosystem. • Rate of primary production: Energy fixed over time. • Gross primary production: Total energy fixed by autotrophs. • Net primary production: Energy leftover after autotrophs’ needs satisfied. Which can consumers use?
How could you measure primary production? • Ecologists usually use one of these… • CO2 uptake • CO2 uptake = sugar production = energy fixed • Biomass: mass of autotrophs • O2 released
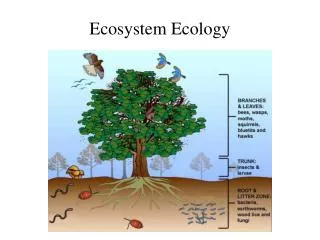
How does primary production affect consumers? • Trophic Level: Position in food web; i.e. # of energy transfers from primary producers to current level: • Primary producers = 1st level. • Primary consumers = 2nd level. • Secondary consumers = 3rd level. • Tertiary consumers = 4th level. There is a limit… at the very most ecosystems support 8 levels (usu. 2-5)
Terrestrial Primary Production What else might affect primary productivity? • Temperature and precipitation affect primary production – duh… • Rosenzweig summarized temp. and precip. using annual actual evapotranspiration (AET). • AET = Amount of H2O that evaporates/transpires off landscape per year (depends on temp. and precip.). • Cold dry ecosystems tend to have low AET. • Warm wet ecosystems? So, how does AET affect primary productivity, do you suppose?
Soil Fertility and Terrestrial Primary Production • Primary production also explained by soil fertility. • Shaver and Chapin: arctic net primary production (npp) 2X greater on fertilized plots. • Most well-known limiting nutrients = Nitrogen (N) and Phosphorus (P). Why N and P?
Also seen in Aquatic and Marine Primary Production • Several studies support + relationship between P/N and phytoplankton. • Perhaps N more limiting in marine, P more in freshwater.
Global Patterns of Marine Primary Production • Highest nutrient rates and productivity found along continental margins. • Nutrient run-off from land. • Sediment disturbance • Open ocean tends to be nutrient poor. • Vertical mixing main nutrient source. Nutrients, water, and temp still don’t explain all primary productivity, what else could there be??????
Consumers also affect primary productivity • Bottom-Up Controls • Influences of physical and chemical factors on ecosystem. • Nutrients, water, temperature • Top-Down Controls • Influences of consumers. • Herbivores eat autotrophs • Carnivores eat herbivores (trophic cascades)
Consumers and Primary Production • Carpenter andKitchell – a trophic cascade e.g. • Large reduction in planktivorous (herbivore-eating) fish populations by top predator = more herbivores. • Abundant, large herbivores reduce phytoplankton biomass and rate of primary production. • Total energy flow reduced So, consumers affect primary production too – but not always is a negative way
Primary Production on the Serengeti • Rate of primary production in the Serengeti positively correlated with rainfall. • McNaughton estimated Serengeti grazers consume 66% of annual primary production. Do you think consumers have an impact? If so, positive or negative?
Primary Production in the Serengeti • Grazers can increase primary production at intermediate levels (say what?). • Growth rates by moderately browsed grasses increased. • Compensatory Growth • Lower respiration rate due to lower biomass. • Reduced self-shading. • Improved water balance due to reduced leaf area. Herbivory can increase overall energy flow!!!
Primary Production in the Serengeti • Light grazing insufficient to produce compensatory growth. • Limited by intraspecific competition, developmental constraints • Heavy grazing reduces plant’s capacity to recover (exploitation). • Intermediate herbivory = highest energy flow Would that be exploitation, commensalism, mutualism?
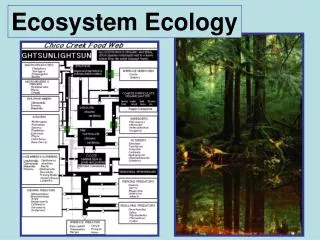
Trophic levels represent energy flow • Lindeman suggested grouping organisms into trophic levels; simplifies study of energy transfer. • Primary producers = 1st level, primary consumers = 2nd level, secondary consumers = 3rd level, etc. • Each feeds on level immediately below. So, how does energy actually ‘flow’?
Trophic Levels and Energy Flow • As energy transferred b/n trophic levels, energy is degraded (second law of thermodynamics) • Limited assimilation, consumer respiration, heat loss • Ecological Efficiency = % energy transfer b/n trophic levels (5-20% on average) • Available energy ↓at higher trophic levels. • Pyramid-shaped energy distribution.
Trophic levels are limited as a result Heat Heat • Eventually, not enough energy for population of higher level consumers • Most ecosystems support 2-5 trophic levels (8 at very most) Decomposers Tertiary consumers (human) Heat 10 100 1,000 10,000 Usable energy available at each tropic level (in kilocalories) Secondary consumers (perch) Heat Primary consumers (zooplankton) Heat Producers (phytoplankton)
Energy Flow in a Temperate Deciduous Forest Herbivores only consume 1% of net production! • Gosz studied solar energy flow: • 15% reflected, 41% heat, 42% evapotranspiration • 2.2% fixed by plants as gross primary production • 1.2% used in plant respiration • 1% net primary production Only 1% of sun’s energy available to consumers!
Review • Primary Production • Temperature and water • Nutrient availability • Consumer effects • Top-down vs. Bottom-up • Trophic Levels/Dynamics • Ecological efficiency • Limits to trophic levels