Download
1 / 15
150 likes | 158 Views
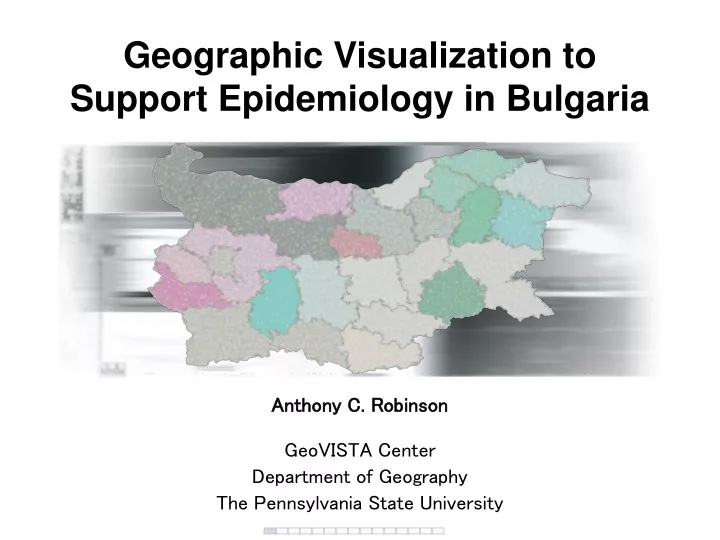
Geographic Visualization to Support Epidemiology in Bulgaria. Anthony C. Robinson GeoVISTA Center Department of Geography The Pennsylvania State University. Outline. Motivation Introduction to Geographic Visualization The ESTAT Toolkit Using ESTAT to explore health in Bulgaria

E N D
Geographic Visualization to Support Epidemiology in Bulgaria Anthony C. Robinson GeoVISTA Center Department of Geography The Pennsylvania State University
Outline • Motivation • Introduction to Geographic Visualization • The ESTAT Toolkit • Using ESTAT to explore health in Bulgaria • Future Directions
Motivation • Health outcomes are closely tied to place and time • Epidemiology requires tools to help explore massive digital databases • Geographic Visualization is a new way to deal with these constraints • Geo-Visualization can help with analysis of health issues in Bulgaria
Geographic Visualization Common GIS • Static maps and graphics • Designed for prescribed analysis • Provides a single view Geo-Visualization • Interactive maps and graphics • Designed for data exploration • Multiple, coordinated views
Geo-Visualization at Penn State • GeoVISTA – Geographic Visualization Science, Technology and Applications Center • GeoVISTA Center creates new Geo-Viz tools for a wide range of application contexts: • Spatial Epidemiology • Emergency Management • Intelligence Analysis • Climate Change
ESTAT • The Exploratory Spatio-Temporal Analysis Toolkit Scatterplot Time Series Graph Parallel Coordinate Plot Choropleth Map
ESTAT • Designed with support from the USA National Cancer Institute (NCI) • Developed by software engineers at GeoVISTA • I worked with Epidemiologists at NCI from 2003-05 to design and evaluate ESTAT • Focused on visualizing cancer incidence, mortality, and socio-economic indicators
Application of ESTAT in USA • We have worked closely with health analysts to explore spatial patterns • ESTAT is intended to help users create new hypotheses or modify those that already exist • One particularly odd pattern has emerged: • Lung Cancer Mortality & Annual Precipitation
Exploring Health in Bulgaria • Data from BG National Center for Health Informatics, Data Presentation System • Data from BG National Statistical Institute 2001 Census results • 472 variables for 28 Oblasts • Incidence/Mortality time series (1996 – 2004) • Health care indicators • Population and social covariates
Exploring Health in Bulgaria ESTAT Demonstration
ESTAT Technical Details • Data requirements: ESRI Shapefile with corresponding databases (in .dbf or .csv formats) • Computer requirements: 512 m. of RAM, installation of the Java environment • Most computers built within the past 5 years will run ESTAT with little trouble
Open-Source Tools • ESTAT and all of the tools we build at GeoVISTA are Open Source • This means that the programs are open to all uses and that the source code is free to anyone who wishes to extend it • In short – ESTAT is free for you to use and modify as you wish!
Future Development • We are currently working to implement spatial statistic methods into ESTAT • ESTAT will be extended with a tool designed to detect clusters among variables • Soon you will be able to save and share your exploration with others
What We Can Do • Collaborate to explore and analyze relevant health issues in Bulgaria • Let us put your data into ESTAT! • We can also work together to design a custom version of ESTAT for Bulgaria
Мерси! This presentation and ESTAT with Bulgaria Data: http://www.personal.psu.edu/acr181/bulgaria.html For more about the GeoVISTA Center: http://www.geovista.psu.edu/ For academic papers see: http://www.personal.psu.edu/acr181/portfolio.html