Download
1 / 1
10 likes | 102 Views
Appendix I Illustration to aid understanding of methodology.

E N D
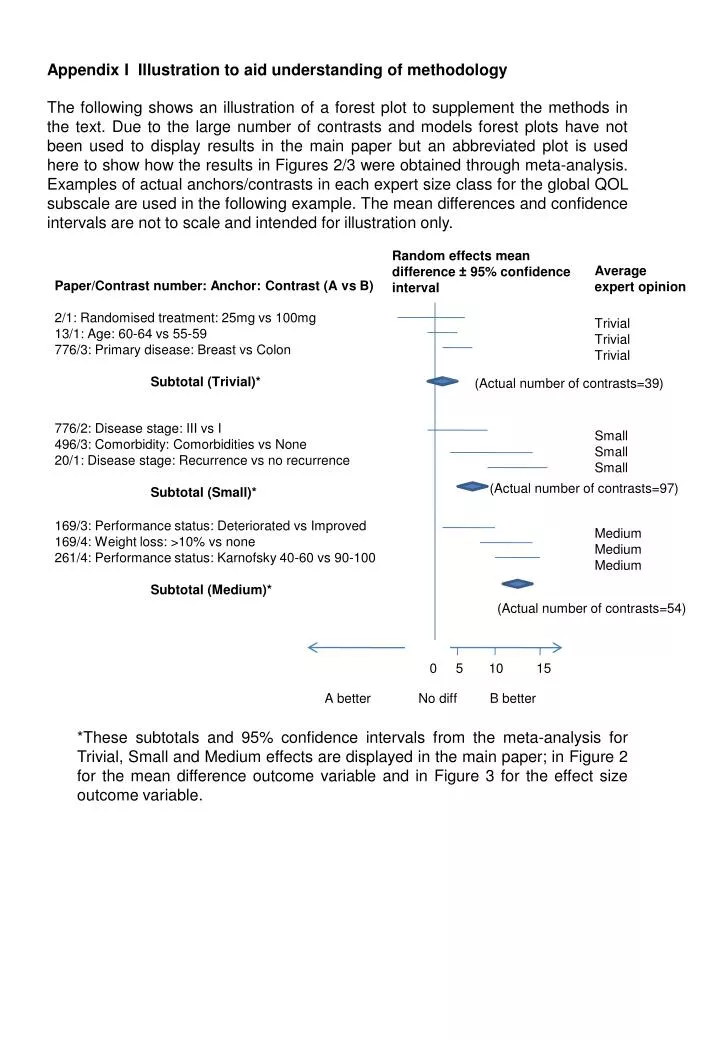
Appendix I Illustration to aid understanding of methodology The following shows an illustration of a forest plot to supplement the methods in the text. Due to the large number of contrasts and models forest plots have not been used to display results in the main paper but an abbreviated plot is used here to show how the results in Figures 2/3 were obtained through meta-analysis. Examples of actual anchors/contrasts in each expert size class for the global QOL subscale are used in the following example. The mean differences and confidence intervals are not to scale and intended for illustration only. Random effects mean difference ± 95% confidence interval Average expert opinion Paper/Contrast number: Anchor: Contrast (A vs B) 2/1: Randomised treatment: 25mg vs 100mg 13/1: Age: 60-64 vs 55-59 776/3: Primary disease: Breast vs Colon Subtotal (Trivial)* Trivial Trivial Trivial (Actual number of contrasts=39) 776/2: Disease stage: III vs I 496/3: Comorbidity: Comorbidities vs None 20/1: Disease stage: Recurrence vs no recurrence Subtotal (Small)* Small Small Small (Actual number of contrasts=97) 169/3: Performance status: Deteriorated vs Improved 169/4: Weight loss: >10% vs none 261/4: Performance status: Karnofsky 40-60 vs 90-100 Subtotal (Medium)* Medium Medium Medium (Actual number of contrasts=54) 0 5 10 15 A better No diff B better *These subtotals and 95% confidence intervals from the meta-analysis for Trivial, Small and Medium effects are displayed in the main paper; in Figure 2 for the mean difference outcome variable and in Figure 3 for the effect size outcome variable.