Download
1 / 60
600 likes | 618 Views
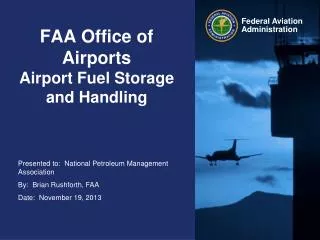
Environmental Seminar. Jake Plante Office of Airports Planning and Environmental Division. George Mason University September 27, 2007. The NEPA “Umbrella” FAA Orders 1050 & 5050. NEPA. Section 106. CAA. CWA. Wetlands.

E N D
EnvironmentalSeminar Jake Plante Office of Airports Planning and EnvironmentalDivision George MasonUniversity September 27, 2007
The NEPA “Umbrella”FAA Orders 1050 & 5050 NEPA Section 106 CAA CWA Wetlands These are only 5 of the >20 laws we examine for airport environmental review purposes.
THE NEPA “UMBRELLA”…WHEN WE FAIL TO COMPLETE INTERDISCIPLINARY ANALYSIS! • Approvals delayed! • Projects delayed! • We didn’t do OUR job!
AIRFA Archeological and Historic Preservation Clean Water/ Clean Air Coastal barrier/zone ESA FWCA Executive Orders Farmland Protection Marine Mammal Pro. Magnuson-Stevens NAGPRA Section 6(f) of L&WCF Section 106 of NHPA Section 303c(4f) Section 47106c of 49 USC Wild and Scenic Rivers Uniform Relocation & Real Property DOT Orders FAA Orders Over 20 Special Purpose Laws and other Airport Requirements
Topics VALE Airport Emissions Airport Noise Noise Over Parks
Aviation Noise Analysis Standard Methodologies for Many Concerns SAE A21 ICAO CAEP FICAN NAT. PARKS INM AIRPORTS INM, AEM, MAGENTA AIRSPACE INM, NIRS, ATNS INM = Integrated Noise Model AEM = Area Equivalent Method ATNS = AT noise screening NIRS = Noise Impact Routing System MAGENTA = Global/national airport modeling forum5.ppt
U.S. Population Exposed to DNL 65dB 750 610 465 202 375 300 MILLION ENPLANEMENTS 5.2 3.4 2.7 0.6 POPULATION 1.7 YEARS
Data Layers • INM tracks and contours • Census data • Airports, runways, navaids • Airport layouts (CAD) • Topography (USGS) • Radar (ARTS) • Special points and grids
A-weighted and Tone-Corrected Perceived Families (not C-weightedor frequency-based) Multiplier (Operations) Time Day Evening Night (Hr.) 1 1 10 24 1 3 10 24 1 1 1 24 1 1 0 15 0 0 1 9 a b c T 1 1 16.7 24 1 3 10 24 a b c T DNL CNEL LMAX Leq SEL Leq-Day TA Leq-Night User-Defined PNLTmax NEF EPNL WECPNL TA User-Defined
Annoyance (e.g., cumulative energy metrics) Speech interference (60-65 dB) Sleep disturbance (e.g., single events, loudness) Schools and learning (e.g., number of events above) Health (single events, loudness) Rattle (low-frequency) Visitor experience and enjoyment (e.g., time-based) Visual intrusiveness (number of events) Effects Driven Use of Supplemental Metrics forum5.ppt
Southern Nevada Supplemental Airport EIS Mesquite EIS Mammoth Lakes EIS St. George EIS (ROD) Flagstaff EA (ROD) Taos EIS Homestead EIS (DOD ROD)Retained airfield but transferred remainder to Dade County for economic development Grand Canyon Air Tour Management Studies Growing number of studies
Step 1: Noise screening assessment and regional inventory of National Parks and other sensitive 4(f) park properties Step 2: Consultation with resource agencies Step 3: Development of a noise protocol for the main noise analysis (approved by AEE) Step 4: Noise measurements (if required) Step 5: Main noise analysis Airports Guidance Outlines a 5-Step Process
Step 1: Noise Screening Assessment • Purpose • To share planning assumptions • To develop an initial study area • To determine need for ambient noise measurements • To base discussions with resource agencies on facts • Possible screening conclusions – by park • No further analysis • Qualitative or descriptive analysis • Quantitative analysis by modeling, statistical,or other information techniques(with or without field measurements)
Send results of screening assessment to Cooperating Agencies, regional resource agencies, Tribes, and individual parks Qualify results as initial Level of follow-up consultationsare based on findings Purpose To elicit outstanding concerns To identify gaps in existing data Data development Need for noise measurements? Appropriate level of analysis? Forecasts of air tour and low-altitude VFR traffic Step 2: Interagency Coordination
Develop noise protocol for main noise analysis Submit to APP-400 & AEEfor approval Contents Scope Methodology, metrics, criteria Ambient field measurements? How analysis will be presented Any modifications to the guidance Step 3: Protocol Submission and Approval
St. George EIS Zion NP Existing Acoustic Zone Map
Step 5: Main Noise Analysis A complete or comprehensive analysis that may include: • A new scope (AI) • More refined receptor locations (grid points) • Project and cumulative analysis • e.g., Military and en route operations • Use of radar data for track dispersion and local (non-standard) aircraft profiles • Variable park ambient levels (ambient maps) • Other supplemental metrics • e.g., Number of Events Above, Audibility (TAUD)
Increased public awareness of air issuese.g., global warming and HAPs Greater focus on aviation EPA and State regulators Europe (e.g., market-based fees) Air Quality Issues Air quality is likely to become a larger constraint in project schedules and project approvals!
CAA Required Not Required Haze Contrails HumanHealth(NAAQS) Global WarmingClimate Change Effects Soot(health) Ozone (smog) CriteriaPollutants CO Air Toxics CO256% Methane 18% CFCs 13% Ozone 7% NOx6% PM10 PM2.5 10 airportpriorities, e.g.,- Benzene- Formaldehyde- Acrolein - NOx- VOCs - SO2- NOx- VOCs- Ammonia Lead NO2 SO2 - 21 MSATs- 188 EPA total
Clean Air Act • Clean Air Act of 1970 – comprehensive • EPA to set National Ambient Air Quality Standards (NAAQS) • States to develop plans to attain standards – called SIPs (State Implementation Plans) • 1990 Clean Air Act Amendments • Conformity requirements (40 CFR Part 93) • Non-attainment designations and plans • Acid rain and air toxics
Standard Primary Secondary Carbon Monoxide (CO) 8 Hour Average 1 Hour Average 9 ppm (10 mg/m3) 35 ppm (40 mg/m3) N/A N/A Particulate Matter(PM10) Annual Arithmetic Ave. 24 Hour Average 50 g/m3 150 g/m3 50 g/m3 150 g/m3 Particulate Matter (PM2.5) 24-Hour Standard Annual Arithmetic Ave. 65 g/m3 15 g/m3 65 g/m3 15 g/m3 Ozone (O3) 8 Hour Average 0.08 ppm 0.08 ppm Sulfur Dioxide (SO2) Annual Average 24 Hour Average 3 Hour Average 80 g/m3 365 g/m3 N/A N/A N/A 1300 g/m3 Lead Calendar Quarter Average 1.5 g/m3 1.5 g/m3 Nitrogen Dioxide (NO2) Annual Average 0.053 ppm (100 g/m3) 0.053 ppm National Ambient Air Quality Standards
EPA Area Designations (by pollutant) Based on State recommendations 3 types Attainment/unclassifiable; Nonattainment; Maintenance Classifications Based on severity of nonattainment problem Correlate with general conformity de minimis levels State Implementation Plans (SIPs) Chief tool for attainment and maintenance of the NAAQS Developed and adopted by States, Tribes, and local agencies EPA approved Penalties for failure to attain (e.g., highway funding, FIPs) EPA Air Quality Management
What Do I Have To Evaluate? NEPA • Emissions Inventory (all pollutants) • Measured in tons per year (tpy) or day (tpd) • Total emissions/all sources in a defined area • Airport emissions compared to SIP budget If required: • Dispersion Analysis (concentrations) • Measured in parts per million (ppm) or g/m3 • Air a person would breathe/specific location • Compared to the NAAQS
Basic Steps for General Conformity 2. Nonattainment or Maintenance Area? 1. Federal Action? yes yes no 3. Exempt? no yes no Exit 7. ConformityDetermination 4. Presumed to Conform? yes no yes no 6. Do project net emissions exceedde minimis levels? 5. EmissionsInventory
Agency list of actions that cause few if any emissions Authorized under GC Rule 1st agency Streamlining benefit Published in July 30, 2007 Federal Register Presumed to Conform List of Airport Actions
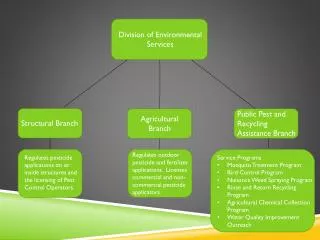
PTC Project Categories For smaller systems and upgrades that do not increase airport capacity or change the operational environment of the airport
Special NEPA Air Quality Issues Hazardous Air Pollutants (HAPS) • FAA Regional coordination with Headquarters • Methodology • EDMS is used for a standard emissions inventory and speciation to hazardous air pollutants (HAPs) • Because of limited data and methods, and the increased uncertainty that could compound errors, we do not: • Compute toxicity weightings • Run a dispersion analysis for HAPs • Calculate population exposure • Do a quantified health risk assessment
Special NEPA Air Quality Issues Climate Change/Greenhouse Gases (GHG) CEQ has deemed GHG reasonably foreseeable: • Contact APP-400/AEE-300 for guidance • A methodology/protocol has not been developed • Airport Cooperative Research Program (ACRP) panel to develop a guidebook
VALE began in 2005 (Vision 100)For commercial service airports in nonattainment or maintenance areas and all airport emission sources except aircraft engine technology
Expands eligibility & funding for clean airport technology Supports a forward-looking approach and early action with emission credits Encourages domestic alternative fuels Improves communications between Airports and States Strengthens community relations VALE Benefits
Project Sites ALB SWF DTW SMF BWI DIA SFO DFW BTR IAH HOU ILEAV Pilot VALE
Airports are Well-Suited to Alternative Fuel Vehicles Microcosm of fleet Centralized operations Available land for safe siting and fuel handling General conformity set to airport facility projects
VALE Funding by Year Millions of Dollars FY ‘05 FY ‘06 FY ‘07
Project Planning What technologies and fuel alternatives are appropriate? What are other airports doing? What are the risks? (airports are well-suited for alternative fuels with central operations and safe siting) How to do a successful application Overcoming Barriers Tendency to rely on SIP accommodations Airline reluctance to use PFCs Coordination with State air quality agencies and EPA Airports need information and technical support
Eligible Infrastructure:Gate Electrification Eligible Infrastructure: Gate Electrification Gate power & pre-conditioned air to reduceAPUusage
Eligible Infrastructure:Underground Fuel Hydrant Systems Fuel CartsreplaceTanker Trucks