Download
1 / 5
50 likes | 176 Views
Experiment setup at CTF2 of 3 GHz Single- Cell Cavity. Faraday cup. RF power. Bidirectional coupler. Pumping group. Cavity. Thermistors. Pulse Shape. Cooling :. Control. We act on PFN voltage. Interlocks: on Faraday cup signal (stops RF pulsing ) and

E N D
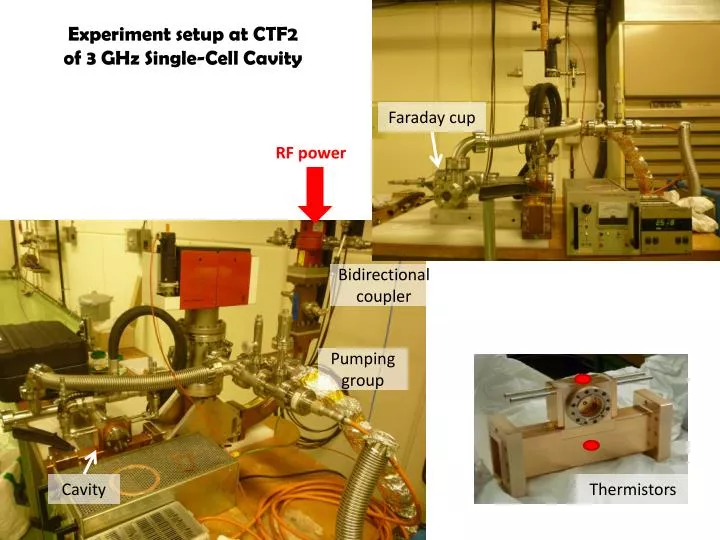
Experiment setup at CTF2of 3 GHz Single-CellCavity Faraday cup RF power Bidirectional coupler Pumping group Cavity Thermistors
Pulse Shape Cooling: Control Weact on PFN voltage. Interlocks: on Faraday cup signal (stops RF pulsing) and On vacuum level (automaticallyrestartsafter 15 seconds –time for normal operation vacuum levelrecovery-).
Diagnostics & Data Acquisition • - Breakdown definition: reflected power and Faraday cup signal • Phase of reflectedis not availableyet (but will do soon)* Cooling: • - Flowmeterreads 5 l/min @ 30°C designed mass flow • Software for temperature acquisition isdebugged and working • HOWEVER we do not expect to detect a temperatureincreasebecause: • Average power in cavityistoolow ~ 5 W (and cooling system wasdesigned for 350 W and 1 degreeinlet-outlet) • Sensorsensitivity: 1 degree Vacuum: 10-8 mbar during normal operation * Not so critical as cavity does not detune for so low average power.
History We Th Fr Sa Su Mo Tu We Scope!: increaselength of « effective » pulse Condition for ~1MW pulse of 1 ms @ 5 Hz Condition for ~1.2 MW pulse of 1 ms @ 5 Hz Scope!: increaserepetition rate to 5 Hz calibration formulae! (0.8 MW peak pulse of 0.6 ms @ 0.8 Hz) Scope!: increase pulse length to 2 ms power intocavity(hundreds of kW) with 0.6 ms pulse @ 0.8 Hz Is comparable to whatwemeasured last year? About 50 MV/m accelerating gradient leads to a BDR of : (2010) 10^-3 bpp (2011) 10^-4 bpp
Strategy • How are weconditioning? • - After breakdown event, the power isslightlydecreased. If stable operation, power isincreased back to the previous value. • Near future: • Givebettershape to pulse (if possible) • If cavityisconditioned for highest power level of interest (E0~ 50 MV/m, Es~ 350 MV/m) BDR measurementsstart Scalinglaw: BDR ~ E^30 1 5 2 4 3 BDR BDR or ? E E