Download
1 / 35
350 likes | 610 Views
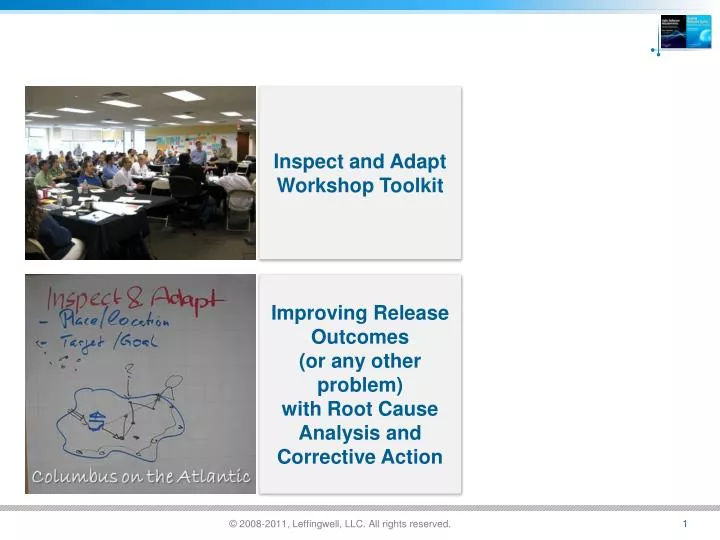
Inspect and Adapt Workshop Toolkit. Improving Release Outcomes (or any other problem) with Root Cause Analysis and Corrective Action. Predictive vs. Empirical Process.

E N D
Inspect and Adapt Workshop Toolkit • Improving Release Outcomes (or any other problem) with Root Cause Analysis and Corrective Action
Predictive vs. Empirical Process If a process is too unpredictable or too complicated for the planned, (predictive) approach, then the empirical approach (measure and adapt) is the method of choice. ̶ Ken Schwaber Empirical (Adaptive) Process Process Outputs Inputs Controls Plan – measure – adapt – repeat
Kaizen Mind • 70% of improvement processes that require change fail, mainly due to a lack of sense of urgency amongst leadership. • ̶ John Kotter, Harvard Business School • There is a sense of danger. • ̶ Koki Konishi, Toyota City Technical Skills Academy • We need “kaizen mind” an unending sense of crisis behind the company’s constant drive to improve. • ̶ Jeff Sutherland – co-creator of Scrum
Kaizen Mind Example Excerpt from a board presentation from a high performing agile program in year 4 of agile adoption
Kaizen Mind and Lean Thinking Continuously solving root problems drives organizational learning • Go and See for yourself to thoroughly understand the situation • Make decisions slowly by consensus, thoroughly considering all options; implement decisions rapidly; • Become a learning organization through relentless reflection ̶ The Toyota Way Image taken from:http://jude-users.com/en/modules/weblog/details.php?blog_id=37
Exercise ‒ Gap Analysis • All release objectives were assigned a business value from 1-10 • Review and rate your release achievements • How well did you do against your stated objectives, including a) timeliness, b) content and c) quality? • Scale: (1-10), max being max total business value • Average these across all objectives and give yourself a percent achievement score • Timebox: ? Exercise – How did we do?
Problem Solving Workshop Insufficiently Reliable Release Commitments? (or) Any other problem that is inhibiting performance
Problem Solving Tools • Root Cause Analysis (Fishbone) Diagram • Pareto Chart • Corrective Action Plan
Root Cause Analysis Diagram • Definition: A graphic tool used to explore and display opinion about sources of variation in a process. • Also called a Cause-and-Effect , Ishikawa Diagram (who first used the technique in the 1960s.) or Fishbone Diagram. • Purpose: To arrive at a few key sources that contribute most significantly to the problem being examined. • These sources are then targeted for improvement. • Also illustrates the relationships among the wide variety of possible contributors to the effect. • The name of a basic problem of interest is entered at the right of the diagram at the end of the main "bone". Source: wikipedia
Root Cause Analysis (Fishbone) Diagram Our main “bones” represent typical sources of problems in software People Process Insufficiently Reliable Release Commitments Tools Project Environment
Root Cause Analysis Diagram, contd. • The main possible causes of the problem (the effect) are drawn as bones off of the main backbone. • The starting bones represent all possible influences. • Brainstorming is typically done to add possible causes to the main "bones" and more specific causes to the "bones" on the main "bones". • This subdivision into ever increasing specificity continues as long as the problem areas can be further subdivided. • The practical maximum depth of this tree is usually four or five levels. • When the fishbone is complete, one has a complete picture of all the possibilities about what could be the root cause for the designated problem. Source: wikipedia
The 5 Why’s • The 5 Whys is a question-asking method used to explore the cause/effect relationships underlying a particular problem. Ultimately, the goal of applying the 5 Whys method is to determine a root cause of a defect or problem. • A critical component of problem solving training integral to the Toyota Production System. • The architect of the Toyota Production System, TaiichiOhno, (Toyota Chairman) described the 5 whys method as "... ... by repeating why five times, the nature of the problem as well as its solution becomes clear.” • The tool has seen widespread use beyond Toyota, and is now used within Kaizen, lean manufacturing, and Six Sigma. Source: wikipedia
Example ‒ The 5 Why’s • Questioning could be taken further to a sixth, seventh, or greater level. • This would be legitimate, as the "five" in 5 Whys is not gospel; rather, it is postulated that five iterations of asking why is generally sufficient to get to a root cause. • The key is to avoid assumptions and logic traps • Instead trace the chain of causality in direct increments from the effect to a root cause that still has some connection to the problem. • My car will not start. (the problem) • Why? – The battery is dead. (first why) • Why?–The alternator is not functioning. (second why) • Why?–The alternator belt has broken. (third why) • Why?–The alternator belt was well beyond its useful service life and has never been replaced. (fourth why) • Why?–I have not been maintaining my car according to the recommended service schedule. (fifth why, root cause) Source: wikipedia
Root Cause Analysis (Fishbone) Diagram Cause of cause of cause of cause 1 Cause of cause of cause 1 People Process Cause of cause 1 Cause 1 Insufficiently Reliable Release Commitments Tools Project Environment
Exercise- Root Cause Analysis • Succinctly state the problem you are addressing • Create a fishbone diagram for your problem statement • Brainstorm potential causes of the problem, and place them on the chart • For each cause identified, use the 5 whys technique to get to a potential root cause • Prepare to present your result • Timebox: ? minutes Exercise – Create your fishbone diagram
Problem Solving Tools • Root Cause Analysis (Fishbone) Diagram • Pareto Chart • Corrective Action Plan
Pareto Analysis • Pareto analysis is a statistical technique in decision making that is used for selection of a limited number of tasks that produce significant overall effect. • It uses the Pareto principle – 20% of the work can generate 80% of the advantage of doing the entire job. • In terms of quality improvement, a large majority of problems (80%) are produced by a few key causes (20%).
Pareto Analysis, contd. • Useful where many possible courses of action are competing for your attention. • The problem-solver estimates the benefit delivered by each action, then selects a number of the most effective actions that deliver a total benefit reasonably close to the maximal possible one. • Helps stimulate thinking and organize thoughts. Source: wikipedia
Prioritize Root Causes Cause of cause of cause of cause 1 Cause of cause of cause 1 People Process Cause of cause 1 Cause of cause 1 Cause 1 Insufficiently Reliable Release Commitments Tools Project Environment
Pareto Analysis Result: a histogram of relative importance of root causes
Exercise- Pareto Analysis • Use a cumulative voting technique to do a Pareto analysis of each identified root cause • Each team member gets 10 votes • Place your votes on as few or as many (limit 5 votes per item) root causes as appropriate • Refactor, re-aggregate causes as appropriate • Use that data to create a big visible histogram chart • Prepare to present your result • Timebox: ? minutes Exercise – Create your Pareto chart
Timebox: ? Group Review of Root Cause Analysis and Pareto Charts
Problem Solving Tools • Root Cause Analysis (Fishbone) Diagram • Pareto Chart • Corrective Action Plan
Houston, we have a problem. After we determine we have a problem, what’s next? • Ignore it - the problem may go away • Blame it on another team • Blame it on the business owner • Blame it on another program • Create a Corrective Action Plan Answer: • Create a Corrective Action Plan Image taken from: www.theage.com.au
Corrective Action Plan What is a Corrective Action Plan anyway? • Corrective – A different course of action • Action – Active steps we can realistically accomplish • Plan – Organized, purposeful, accountable, measurable No solution without a CAP
Effective Corrective Action Plans • State the new problem (the selected root cause) succinctly • Brainstorm a solution. Divide into discrete activities. • Establish accountability • Specify measurable results • Set achievable deadlines • Monitor progress A journey of a thousand miles begins with a single step.
Corrective Action Plan Components • State the new problem succinctly • Pick one specific root cause, i.e. the top root causes that you identified in your analysis • Restate that as the new problem Root cause of the problem
Corrective Action Plan Components • Brainstorm a solution • Brainstorm prospective solutions with the team • Cumulative vote on suggested next steps How do you eat an elephant? One bite at a time.
Corrective Action Plan Components • Establish accountability • Identify the stories you’ll need to effect the solution • Take responsibility for stories • Prepare to put the stories on your release plan • Escalate those impediments that are outside of your control
Corrective Action Plan Components • Specify measurable results • What measures can we use to track progress?
Corrective Action Plan Components • Set achievable deadlines • Not to fast • Not to slow • Not TBD • Action 1 • 3/16/20011 • Action 3 • 5/01/2011 TBD • Action 2 • 4/11/2011
Corrective Action Plan Components • Monitor Progress • How will we track our action steps? • How will we know when this is no longer the biggest problem? • Define what “done” means for the CAP
Effective Corrective Action Plans • State the problem succinctly • Brainstorm a solution. Divide into discrete parts. • Establish accountability • Specify measurable results • Set achievable deadlines • Monitor progress Houston, We have a plan
Exercise- Corrective Action Plans • Pick the top root cause on your Pareto chart • Build a corrective action plan • Prepare to present your results • Timebox: ? minutes Exercise – Build Your Corrective Action Plan
1 …… 2 ….. 3 ….. 4 ….. 5 ….. 6 ….. Timebox: ? minutes Group Review of Corrective Action Plans