Download
1 / 24
240 likes | 412 Views
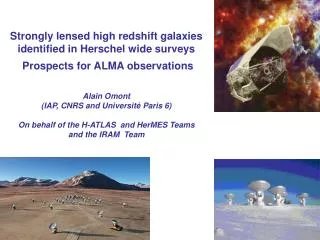
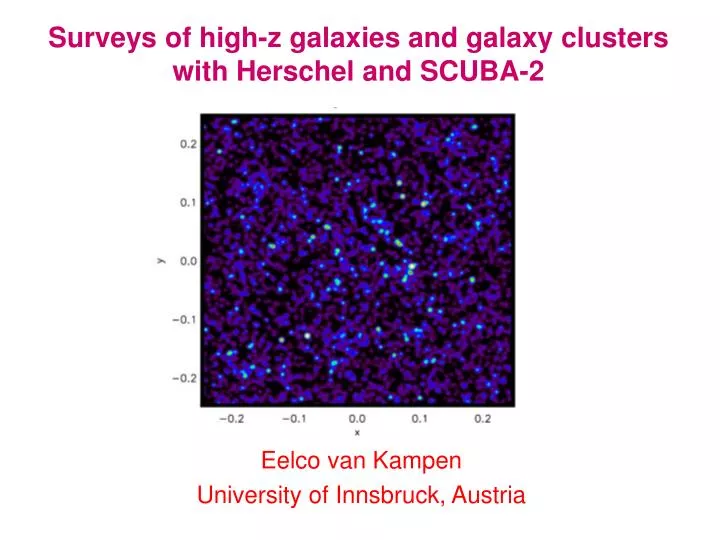
Surveys of high-z galaxies and galaxy clusters with Herschel and SCUBA-2. Eelco van Kampen University of Innsbruck, Austria. Stars. Dust. Dust emission: far-IR & sub-mm. PACS SPIRE. Dusty star-forming galaxies emit much of their light at IR to mm wavelengths.

E N D
Surveys of high-z galaxies and galaxy clusters with Herschel and SCUBA-2 Eelco van Kampen University of Innsbruck, Austria
Stars Dust Dust emission: far-IR & sub-mm PACS SPIRE Dusty star-forming galaxies emit much of their light at IR to mm wavelengths Figure compiled by Mari Polletta r IRAC MIPS SCUBA-2
SHADES: SCUBA half-degree survey 2 fields – Lockman Hole & SXDF @ 850 micron 120 sources with unbiased (deboosted) flux densities
Estimating the angular correlation function w() w(θ) from the Landy & Szalay (1993) estimator: Lockman Hole SXDF Kent reduction noise maps
Random catalogues from the noise maps S > 5 mJy • Procedure: • generate a uniformly distributed point source distribution • assign a flux according to number counts of Coppin et al. (2006) • add random (Gaussian) noise using the noise map • keep sources in the random catalogue with S > 2.5σmap
Random cat. + SHADES cat. w(θ) S > 5 mJy Lockman S > 6 mJy Kent reduction data only
Fitting to • non-linear 2-fitting using the Levenberg-Marquardt method • the fitting includes the integral constraint taken from a look-up table • fitting functions are the angular correlation function w() = (/A) and the sky-averaged correlation function: • the sky-averaging produces correlated errors, which is taken into account by using the full covariance matrix to construct an alternative 2-statistic
SHADES clustering measurement Lockman >6mJy SXDF >6mJy Large dots and solid line (fit) for the angular correlation function w(θ)=(θ/A) Stars and dashed line (fit) for the sky-averaged angular correlation <w>Ω(θ) Lockman: A = 11.0" +/- 8.7" SXDF: A = 27.4" +/- 14.7” = 0.76 +/- 0.31 = 0.91 +/- 0.43 (both estimates from the sky-averaged angular correlation functions)
Model-data comparison for SHADES Fit to slope and amplitude for 25 mocks for four different galaxy formation models van Kampen et al. (2005)
Model-data comparison for SHADES Lockman Hole SXDF
SCUBA-2 SCUBA-2 is a new generation imager for the JCMT • Novel scanning mode to realise large-area surveys • Imaging of the sky at 450 and 850m simultaneously • A large (>50 arcmin2) field-of-view • Sensitivity governed by the sky background • Provide fully-sampled images of the sky in ~ 4 seconds SCUBA-2 will bring “CCD-style” imaging to the JCMT for the first time
SCUBA-2 Cosmology Legacy Survey SHADES 2 years 5 years
850 m survey: 450 m survey: Survey fields Field selection (partly) driven by complementary data of the required depth; e.g., KAB=25
H1K fields (white blocks) superimposed on the IRAS 100 micron maps H1K: proposed Herschel 1000 sq. degree survey In the north the outlines of the other surveys are: 2dFGRS - continuous blue; VIKING/KIDS - cyan; GAMA - magenta ; SDSS - yellow. The red circle shows the area covered by the Coma cluster. In the south the surveys are: 2dFGRS - continuous blue; VIKING/KIDS - cyan; Dark Energy Survey - magenta; South Pole Telescope - dashed blue.
Galaxy evolution in and around clusters The z=0.5 galaxy cluster J0717.9 Subaru SuprimeCam VRz image with galaxy surface density contours in red and the area of the ACS field outlined in green. The ACS field traces the filamentary structure evident from the density contours (Rich & Ebeling 2007)
Panoramic imaging in and around clusters Subaru BVRI imaging of A851 and its infall region by Kodama et al. 2001. Red dots are at the cluster redshift according to their photometric redshifts.
Exploit unique capabilities of Herschel Figure compiled by Mari Polletta
Herschel Open-Time Key-Programme proposal to study the cluster infall region • use well-defined rich cluster sample at z≈0.5 • map the infall region around these clusters out to around 5 Mpc (depending on cluster mass) • measure SFR and LIR for each galaxy • measure stellar masses from near-IR (follow-up or existing) • remove interlopers (foreground/background) • define environment
A survey of panoramic surveys Target fields for the Herschel proposal “Studying galaxy evolution where it happens”
Summary Only far-IR and sub-mm observations allow us to survey dusty star-formation at high redshifts and in over-dense regions. The future is blobby !