Download
1 / 5
50 likes | 61 Views
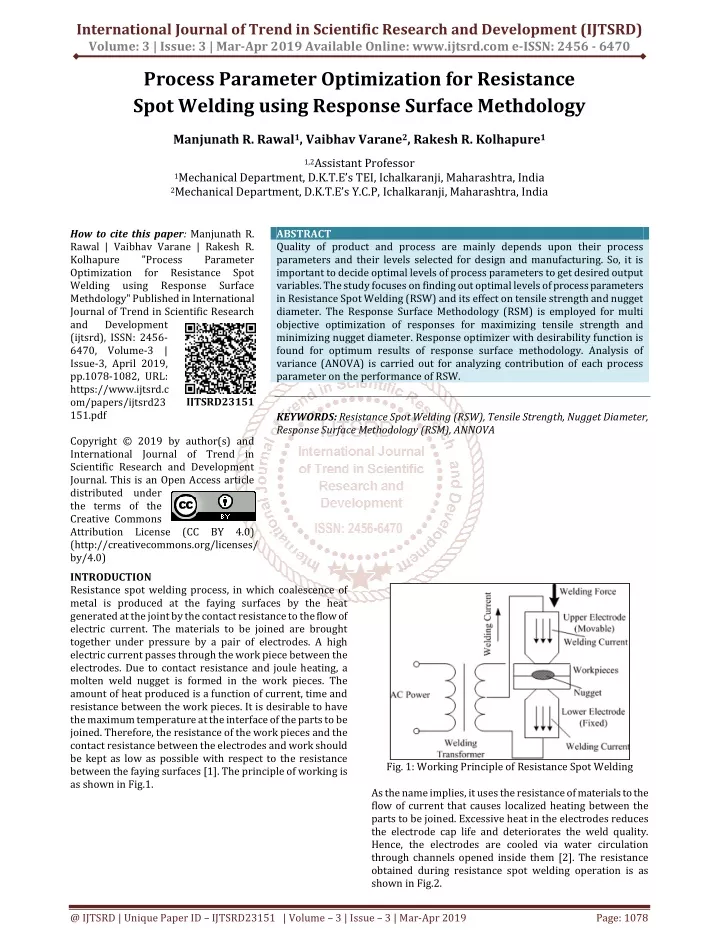
Quality of product and process are mainly depends upon their process parameters and their levels selected for design and manufacturing. So, it is important to decide optimal levels of process parameters to get desired output variables. The study focuses on finding out optimal levels of process parameters in Resistance Spot Welding RSW and its effect on tensile strength and nugget diameter. The Response Surface Methodology RSM is employed for multi objective optimization of responses for maximizing tensile strength and minimizing nugget diameter. Response optimizer with desirability function is found for optimum results of response surface methodology. Analysis of variance ANOVA is carried out for analyzing contribution of each process parameter on the performance of RSW. Manjunath R. Rawal | Vaibhav Varane | Rakesh R. Kolhapure "Process Parameter Optimization for Resistance Spot Welding using Response Surface Methdology" Published in International Journal of Trend in Scientific Research and Development (ijtsrd), ISSN: 2456-6470, Volume-3 | Issue-3 , April 2019, URL: https://www.ijtsrd.com/papers/ijtsrd23151.pdf Paper URL: https://www.ijtsrd.com/engineering/mechanical-engineering/23151/process-parameter-optimization-for-resistance-spot-welding-using-response-surface-methdology/manjunath-r-rawal<br>

E N D
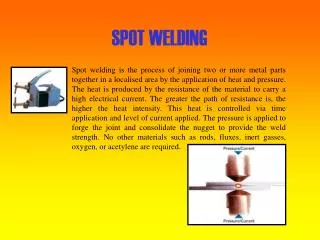
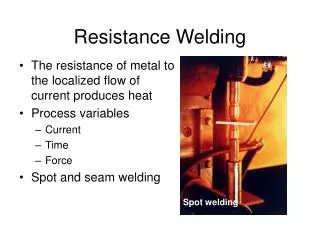
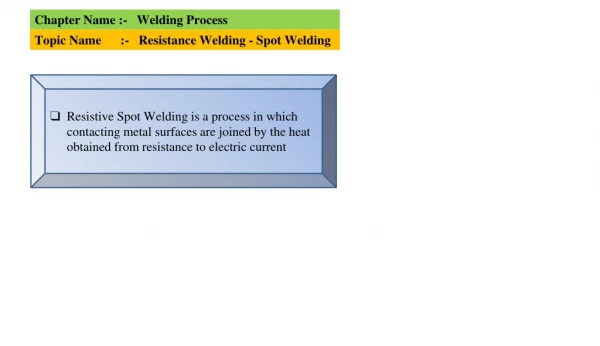
International Journal of Trend in Scientific Research and Development (IJTSRD) Volume: 3 | Issue: 3 | Mar-Apr 2019 Available Online: www.ijtsrd.com e-ISSN: 2456 - 6470 Process Parameter Optimization for Resistance Spot Welding using Response Surface Methdology Manjunath R. Rawal1, Vaibhav Varane2, Rakesh R. Kolhapure1 1,2Assistant Professor 1Mechanical Department, D.K.T.E’s TEI, Ichalkaranji, Maharashtra, India 2Mechanical Department, D.K.T.E’s Y.C.P, Ichalkaranji, Maharashtra, India How to cite this paper: Manjunath R. Rawal | Vaibhav Varane | Rakesh R. Kolhapure "Process Parameter Optimization for Resistance Spot Welding using Response Surface Methdology" Published in International Journal of Trend in Scientific Research and Development (ijtsrd), ISSN: 2456- 6470, Volume-3 | Issue-3, April 2019, pp.1078-1082, URL: https://www.ijtsrd.c om/papers/ijtsrd23 151.pdf Copyright © 2019 by author(s) and International Journal of Trend in Scientific Research and Development Journal. This is an Open Access article distributed under the terms of the Creative Commons Attribution License (CC BY 4.0) (http://creativecommons.org/licenses/ by/4.0) INTRODUCTION Resistance spot welding process, in which coalescence of metal is produced at the faying surfaces by the heat generated at the joint by the contact resistance to the flow of electric current. The materials to be joined are brought together under pressure by a pair of electrodes. A high electric current passes through the work piece between the electrodes. Due to contact resistance and joule heating, a molten weld nugget is formed in the work pieces. The amount of heat produced is a function of current, time and resistance between the work pieces. It is desirable to have the maximum temperature at the interface of the parts to be joined. Therefore, the resistance of the work pieces and the contact resistance between the electrodes and work should be kept as low as possible with respect to the resistance between the faying surfaces [1]. The principle of working is as shown in Fig.1. ABSTRACT Quality of product and process are mainly depends upon their process parameters and their levels selected for design and manufacturing. So, it is important to decide optimal levels of process parameters to get desired output variables. The study focuses on finding out optimal levels of process parameters in Resistance Spot Welding (RSW) and its effect on tensile strength and nugget diameter. The Response Surface Methodology (RSM) is employed for multi objective optimization of responses for maximizing tensile strength and minimizing nugget diameter. Response optimizer with desirability function is found for optimum results of response surface methodology. Analysis of variance (ANOVA) is carried out for analyzing contribution of each process parameter on the performance of RSW. KEYWORDS: Resistance Spot Welding (RSW), Tensile Strength, Nugget Diameter, Response Surface Methodology (RSM), ANNOVA IJTSRD23151 Fig. 1: Working Principle of Resistance Spot Welding As the name implies, it uses the resistance of materials to the flow of current that causes localized heating between the parts to be joined. Excessive heat in the electrodes reduces the electrode cap life and deteriorates the weld quality. Hence, the electrodes are cooled via water circulation through channels opened inside them [2]. The resistance obtained during resistance spot welding operation is as shown in Fig.2. @ IJTSRD | Unique Paper ID – IJTSRD23151 | Volume – 3 | Issue – 3 | Mar-Apr 2019 Page: 1078
International Journal of Trend in Scientific Research and Development (IJTSRD) @ www.ijtsrd.com eISSN: 2456-6470 Experimental work In the present research work three process parameters (factor) were chosen, all of them were set at three different levels shown in Table 1. Stainless steel of 304 grade is selected for experimentation, specimens are prepared as per AWS (American Welding Society) standards. Fig. 2: The Resistance obtained during resistance spot welding operation Table 1: Process Parameters and Levels Sr. No. Process parameters Parameters Level 1 Level 2 Level 3 1 Welding Current A 4.8 5.9 7 2 Electrode Force B 0.490 0.539 0.588 3 Welding Time C 45 50 55 Required experiments for the RSM were designed using the box-behnken method. This design is based on a 3×3 factorial design, three replicates of the central run, leading to 10 sets of experiments, enabling each experimental response to be optimized. The responses were investigated using a box–behnken statistical experimental design. All experiments were performed in standard order to minimize the effects of uncontrolled factors that may introduce a bias in the response. This helps in achieving high quality with fewer losses [4]. In this work, it helps to achieve following objectives. ?Optimizing parameter levels for tensile strength and nugget diameter. ?To estimate the contribution of each parameter for response values. ?Optimize best combination, which yields maximum tensile strength (T-S) and minimum Nugget diameter (N-D). Experimental trials were conducted according to box behnken design. Results obtained for each trial for responses are as shown in Table 2. Table 2: Experimental run by Box Behnken and response variables T-S (KN) 5.780 4.846 N-D (MM) Expt. No. Welding Current (KA) Electrode Force (KN) Welding Time (cycle) 1 7.0 0.490 50 2 5.9 0.539 50 5.136 4.855 3 4.8 0.539 45 3.654 3.527 4 4.8 0.490 50 3.602 3.527 5 5.9 0.490 45 5.333 4.556 6 5.9 0.539 50 5.136 4.855 7 7.0 0.588 50 6.046 6.231 8 5.9 0.588 55 5.308 5.012 9 4.8 0.539 55 3.974 3.909 Response Surface Methodology: Response Surface Methodology (RSM) explores the relationships between several explanatory variables and one or more response variables. The method was introduced by George E. P. Box and K. B. Wilson in 1951. The main idea of RSM is to use a sequence of designed experiments to obtain an optimal response. Box and Wilson suggest using a second- degree polynomial model to do this. They acknowledge that this model is only an approximation, but they use it because such a model is easy to estimate and apply, even when little is known about the process. Box–Behnken designs are experimental designs for response surface methodology, designed by George E. P. Box and Donald Behnken in 1960 [4-6]. Results and Discussion: Effects of process parameters for Tensile Strength Analysis of variance (ANOVA) has been used in order to examine the effect of the parameters in the fitted regression model. The results of ANOVA for Tensile Strength is presented in Table 3. The P values less than 0.05, indicates that the desired parameters are effective [8]. It was observed that the terms linear, welding current, square and electrode force are effective in the regression model. @ IJTSRD | Unique Paper ID - IJTSRD23151 | Volume – 3 | Issue – 3 | Mar-Apr 2019 Page: 1079
International Journal of Trend in Scientific Research and Development (IJTSRD) @ www.ijtsrd.com eISSN: 2456-6470 Analysis of Variance (Tensile Strength) Table 3: Analysis of Variance for Tensile Strength Source DF Adj SS Model 5 6.54464 1.30893 Linear 3 5.54340 1.84780 Welding Current (A) 1 5.03755 5.03755 Electrode Force (B) 1 0.03857 0.03857 Welding Time (C) 1 0.00163 0.00163 Square 1 0.34253 0.34253 A2 1 0.34253 0.34253 Interaction 1 0.11022 0.11022 B*C 1 0.11022 0.11022 Error 4 0.07952 0.01988 Total 9 6.62417 Adj MS F Value P Value 65.84 92.94 253.39 1.94 0.08 17.23 17.23 5.54 5.54 0.001 0.000 0.000 0.236 0.789 0.014 0.014 0.078 0.078 Regression Equation: The model developed using RSM in MINITAB 17 software is, TS = 5.38 + 4.807 A - 32.3 B - 0.362 C - 0.3263 A2 + 0.678 B*C. Contour plots of Tensile Strength for electrode force and welding current, keeping welding time constant at 45 cycle is shown in Fig.4. It is observed that tensile strength is maximum in between 6.5 to 7 KA current value. And for electrode force as constant value (0.490 KN) we will get maximum strength in between 6.3 – 7 KA welding current and 45 – 47.5 as minimum welding time (Fig. 5). Fig.4: Contour Plot of TS Vs Electrode Force, Welding Current Fig. 8: Surface Plot of TS vs Electrode Force, Welding Current Fig. 5: Contour Plot of TS vs Welding Time, Welding Current Fig. 9: Surface Plot of TS vs Welding Time, Welding Current From surface plot of tensile strength as response variable it is clear that desired output variable values are increases as welding current, electrode force and welding time increases. (Refer Fig. 6 & 7). Effects of process parameters for Nugget Diameter Analysis of Variance Results of ANNOVA for nugget diameter as response variable is shown in Table. 4. F value is maximum for welding current, which is most significant process parameter for nugget diameter. Which means higher the value of current larger the diameter of nuuget formed during welding. @ IJTSRD | Unique Paper ID - IJTSRD23151 | Volume – 3 | Issue – 3 | Mar-Apr 2019 Page: 1080
International Journal of Trend in Scientific Research and Development (IJTSRD) @ www.ijtsrd.com eISSN: 2456-6470 Table 4: Analysis of Variance for Nugget Diameter F P Source DF Adj SS Adj MS Value 56.69 56.69 Value 0.000 0.000 Model Linear Welding Current Electrode Force Welding Time Error Total 3 3 5.8884 1.96278 5.8884 1.96278 1 4.8944 4.89439 141.37 0.000 1 0.1925 0.19251 5.56 0.056 1 0.2979 0.29787 8.60 0.026 6 9 0.2077 0.03462 6.0961 Regression Equation: The model developed using RSM in MINITAB 17 software is, ND = - 4.85 + 0.9262 A+ 3.47 B + 0.0462 C Contour plots of Nugget Diameter for electrode force and welding current, keeping welding time constant at 45 cycle is shown in fig.6. It is observed that nugget diameter is maximum in between 6.5 to 7 KA current value. And for electrode force as constant value (0.490 KN) we will get maximum nugget diameter in between 6.5 – 7 KA welding current and 52.5 - 55 as welding time (Fig. 7). Fig. 8: Surface Plot of ND vs Electrode Force, Welding Current Fig. 9: Surface Plot of ND vs Welding Time, Welding Current To test whether the data are well fitted in the model or not, the value of S and R2 are observed. In general, the more appropriate regression model is the higher the values of R2 (R is correlation coefficient) and the smaller the values of S (standard errors of samples). From the developed models, calculated S value of the regression analysis on diameter of weld nugget is 0.186070 and Tensile Strength is 0.140999, which are smaller and R2 value for both response (Diameter of weld nugget and Tensile Strength) are 88.56 % and 89.54 % respectively, these are moderately high, therefore the data for each response are well fitted in the developed models. Response Optimization: Tensile Strength and Nugget Diameter Optimization Plot The desirability function simultaneously optimize the multiple responses and was later modified by Derringer and Such [5-6] to improve its practicality. The desirability function approach is one of the most frequently used multi- response optimization techniques in practice. The desirability lies between 0 and 1 and it represents the closeness of a response to its ideal value. If a response falls within the unacceptable intervals, the desirability is 0, and if a response falls within the ideal intervals or the response reaches its ideal value, the desirability is 1. In order to use the desirability function, an area should be specified to obtain optimum point. The tensile strength should be maximum and nugget diameter should be Fig. 6: Contour Plot of ND vs Electrode Force, Welding Current Fig. 7: Contour Plot of ND vs Welding Time, Welding Current Surface plots for Nugget diameter as response are shown in fig. 8 & 9. @ IJTSRD | Unique Paper ID - IJTSRD23151 | Volume – 3 | Issue – 3 | Mar-Apr 2019 Page: 1081
International Journal of Trend in Scientific Research and Development (IJTSRD) @ www.ijtsrd.com eISSN: 2456-6470 ?The experimental results shows that, maximum tensile strength and minimum nugget diameter is achieved by optimal combinations, welding current of 5.97 KA, electrode force of 0.490 KN and welding time of 45 cycles. ?From ANOVA results, it reveals that welding current is the most significant process parameter for maximizing strength of spot weld and also responsible for formation of nugget during welding. References: [1]U. Esme, Application of Taguchi Method for the Optimization of Resistance Spot Welding Process, The Arabian Journal for Science and Engineering, 2008, 34, p 519-528. minimum. For this issue, first the target and the upper bound should be determined . For the response tensile strength, the target value is selected 6.046 KN. This value is considered from run number 7 of Table 2 in which the highest strength for spot welding is obtained. Also the lower bound is selected 3.602 which is considered from run number 4 of table 2. For the response nugget diameter the target value selected is 3.527 which is minimum, selected from run number 3 of table 2. The optimization results using the mentioned information are shown in Figure 10. According to this figure, the composite desirability of the obtained point is 0.6718. Table 5 shows the optimal point values. In order to evaluate the optimal point, the results of this point were compared with the results of the normal simulation. The results show the improvement of the tensile strength with optimal point values in optimized model compared to the original model. Also there is reduction in nugget diameter in optimized model compared to original model. [2]A. G. Thakur, and V. M. Nandedkar, Application of Taguchi Method to Determine Resistance Spot Welding Condition of Austenitic Stainless Steel AISI 304, Journal of Scientific and Industrial Research, 2010, 69, p 680- 683. [3]N. Muhammad, and H. P. Manurung, Design Parameters Selection and Optimization of Weld Zone Development in Resistance Spot Welding, World Academy of Science, Engineering and Technology, 2012, 72, p 1220-1225. [4]S. Raissi, and R- Eslami Farsani, “Statistical Process Optimization through Methodology,” World Academy of Science, Engineering and Technology, vol. 51, 2009. Multi-Response Surface [5]Dayananda Pai et .al. “Application of Response Surface Methodology On Surface Roughness In Grinding Of Aerospace Materials (6061Al 15Vol%SiC25P),” ARPN Journal of Engineering and Applied Sciences, VOL. 5, NO. 6, JUNE 2010. [6]Pawan Kumar et. Al. “Optimization of Process Parameters in Surface Grinding Using Response Surface Methodology,” IJRMET Vol. 3, Issue 2, May - Oct 2013. A Quality Improvement Approach for Resistance Spot Welding using Multi-objective Taguchi Method and Response Surface Methodology,” IJASTIT Vol. 2 (2012) No. 3. Fig. 10: Optimization plot for Tensile Strength and Nugget Diameter as response. Table No. 5: Optimal point values using desirability function Parameters Welding Current (KA) Electrode Force(KN) Welding Time (Cycle) Conclusions: In this research work multi response optimization of resistance spot welding is carried out by using response surface methodology technique. From analysis following conclusion points are noted, Values 5.97 0.490 45 [7]Norasiah Muhammad, “A Quality Improvement Approach for Resistance Spot Welding using Multi- objective Taguchi Method and Response Surface Methodology,” IJASTIT,Vol. 2 (2012) No. 3. [8]Asal V. D, Patel R. I. and Choudhary, A. B, “Optimization of Process Parameters of EDM using ANOVA Method,” International Journal of Engineering Research and Applications, 2013, vol. 2, 1119-1125 @ IJTSRD | Unique Paper ID - IJTSRD23151 | Volume – 3 | Issue – 3 | Mar-Apr 2019 Page: 1082