Download
1 / 24
240 likes | 363 Views
The Most At-Risk First Time in College Students: Using Assessment Techniques to Identify and Assist Them. Prepared for the International Assessment and Retention Conference, Assessment Reconsidered: Improving Learning, Student Success, and Transparency , 11–15 June 2008. Scottsdale, Arizona.

E N D
The Most At-Risk First Time in College Students: Using Assessment Techniques to Identify and Assist Them Prepared for the International Assessment and Retention Conference, Assessment Reconsidered: Improving Learning, Student Success, and Transparency, 11–15 June 2008. Scottsdale, Arizona. Bernadette M.E. Jungblut, Ph.D. – Assistant Director Daniel Suleski – Coordinator of Statistical Research Brittany L. Resmann – Coordinator of Assessment and Research Office of Assessment and Planning Student Development and Enrollment Services University of Central Florida Orlando, FL 32816-0160
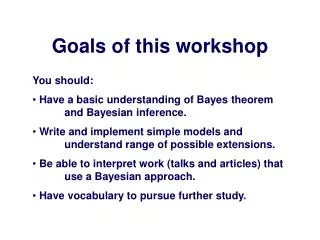
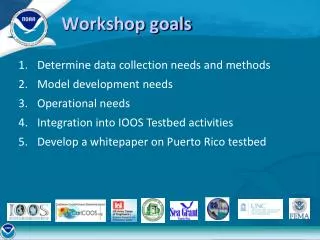
Workshop Goals • Discuss the methods used to predict which First Time in College (FTIC) students are the most likely to be at risk for retention failure in their first year at UCF • Describe a targeted intervention, the Knight Success Program, designed to assist these students and increase the likelihood of their engagement and persistence • Provide session participants with several opportunities to: • Discuss the applicability of these methods at your institutions • Discuss the generalizability of this type of intervention to your institutions • Examine the efficacy of this approach in your specific institutional contexts
Workshop Agenda • Introduction • Short activity to assess participants’ needs and primary interests • UCF Project Overview • Discussion of applicability to participants’ institutions • UCF Project Findings and Next Steps • Discussion of participants’ expectations about at-risk students • UCF Program Components • Discussion of program’s generalizability to other institutions
Short Activity: Questions to Consider • Are you currently identifying at-risk incoming students? • If so, what techniques are you using to identify those students? Who are your at-risk incoming students? • If not, do you plan to do so in the future – and what factors do you expect to be “likely suspects” to help you identify these at-risk students? • Do you currently have targeted intervention programs in place for at-risk incoming students? If so, choose one (1) to focus on for this activity. • How is this program structured? What are the program’s primary components? • How is this program staffed? • How are you recruiting students for this program? • How are you connecting and communicating with these students? • If you do not have targeted intervention programs in place for at-risk incoming students, are you planning to design and implement such programs? • What components would you include in such a program?
Facts about UCF • Largest undergraduate enrollment and second largest total enrollmentin Florida • Sixth largest university in the country by total enrollment; second largest in the country in terms of undergraduate enrollment • Fall 2007 Enrollment: 48,669 • 2007-2008 FTIC Applications: 26,986 • 2007-2008 FTIC Applications Accepted: 13,406 (49.7%) • 2007-2008 New FTICs Enrolled: 6,717 Sources: UCF Office of Undergraduate Admissions US Department of Education Office of Postsecondary Education
Enrollment Trends • Enrollment of first-time college students at UCF continues to increase while the number of traditional first-time students beginning in Fall is capped • Enrollment increasingly accommodated through Summer admission
Quality of Incoming Students • Average SAT score of incoming first-time students continues to increase • Slight dip in 2005 coincides with introduction of the SAT writing section in March 2005 • Average High School GPA has also increased over time • Dip in 2005 coincides with a State of Florida reduction in the weighting of AP and dual enrollment coursework
Knight Success Program – Motivation • Improvement in first-year retention stagnated despite improving admissions profile. • What can be done to improve first-year retention when simply admitting “better” students no longer seems to work?
Knight Success Program – Development Hypothesis: • The university can enhance its first-year retention rate by engaging students who are most at-risk for dropping out after their first year. Action Plan: • Develop a program to engage our most at-risk students. Problem: • How do we know which students are the most at-risk before they begin their college career?
Knight Success Program – Development Solution: • Use what we already know about our incoming students to formulate a predictor of first-year retention. Resources available: • Information new students provide to admissions • Information current and former students have provided to admissions, along with their retention outcomes
Knight Success Program – Data What does the university know about students before they arrive on campus? • Standardized test scores • High school grades and coursework attempted • Class rank and percentile • Financial aid • On-campus housing requests • Personal demographics (age, gender, ethnicity, etc.) • Residency (in-state, out-of-state, international) • Name and type of high school (public/private/home school/etc.) • College credits earned (Advanced Placement, Dual Enrollment, International Baccalaureate, etc.) • Major student is pursuing (or undeclared status)
Factors to Examine at Your Institution • Which of these factors are relevant to your institution? • Which are not relevant or applicable? • What other factors would you need or want to include in your models?
Knight Success Program – Data Analysis • Model building: Use information from past admissions and outcomes to construct, test, and validate predictive models. • Model selection: Choose the model with the highest hit rate. • Hit rate: Total correctly predicted non-retained students divided by the total number of students not retained
Knight Success Program – Modeling • Entropy split criterion found to be the best model
Knight Success Program – Decision Rules • Decision Rule 1: - High school GPA less than 3.25 - About 30% of 1,000 most at-risk students • Decision Rule 2: - Total SAT score is greater than or equal to 1240 - High school GPA is between 3.25 and 4.15 - Student is a National Merit Scholar Finalist - About 10% of 1,000 most at-risk students • Decision Rule 3: - Total SAT score is greater than or equal to 1000 - SAT math score is greater than or equal to 460 - High school social sciences unit GPA is greater than 4.05 - High school English unit GPA is greater than 4.75 - About 60% of 1,000 most at-risk students
Knight Success Program – Results • Retention Outcomes • KSP-selected students have a lower retention rate than non-selected students. • The KSP model is an effective predictor of at-risk students. • KSP participants have a higher retention rate than non-participants. • KSP participation is effective in improving first-year retention.
Other Student Outcomes of KSP • Students selected for KSP are typically more likely to be placed on academic probation than non-selected students. • Participants in the KSP program are less likely to be placed on academic probation than non-participants. • Academic Probation
Other Student Outcomes of KSP • Students selected for KSP typically have lower term GPAs than non-selected students. • Participants in the KSP program typically have higher term GPAs than non- participants. • Term GPA
Next Steps • Comparison of data mining models with deductively derived logistic regression models • More in-depth examination of additional factors • FCAT scores (Florida’s state-wide assessment of high school students) • First generation in college status • Socioeconomic factors including financial aid status • AP, IB, and Dual Enrollment credits earned in high school • High school curricula and credits earned by subject area • CSRDE NSSR Follow-up Presentation: 29 September–1 October
KSP Components Years 1 and 2 • Year 1 (AY 2005-2006) • August 2005 start (for September 2005 program launch) • Identified 1000 students; recruited 200 active participants • Incentives provided (bookstore coupons) • Distributed among all 12 first-year advisors • Skills assessments for 200 active participants • Engagement events for all 1,000 students invited to participate • Year 2 (AY 2006-2007) • May 2006 start (for summer and fall program infusion) • Identified 1000 students; recruited 200 active participants • No incentives provided except opportunity for skills assessment • Assigned to one of two dedicated KSP Advisors • Infused into approximately 16 Orientations (May through August) • Skills assessment = Strength Quest (for 200 students) • Engagement events • E-mail contact • SLS 1501 – Strategies for College Success course
KSP Components Years 3 and 4 • Year 3 (AY 2007-2008) • Very similar to Year 2 • Same two KSP Advisors • Added First Year Advising and Exploration (FYAE) Peer Advisors • Special Orientation sessions for KSP selected students (logistical problems) • Year 4 (AY 2008-2009) • Somewhat similar to Year 3 • Same two KSP Advisors • Focus on engagement and academic success strategies • Enhanced communication and contact (e-mail plus more face-to-face) • Orientation sessions revised • Day 1 = KSP Cohort special sessions • Day 2 = College schedule planning (to address Year 3 logistical problems) • KSP Advisors design 20- to 30-student intensive pilot program
Program Components • Which of these KSP components are relevant to your institution? • Which are not relevant or applicable? • What other components would you need or want to include?
Questions? • Bernadette M.E. Jungblut, Ph.D. bjungblu@mail.ucf.edu • Daniel Suleski dsuleski@mail.ucf.edu • Brittany L. Resmannbresmann@mail.ucf.edu
Research Collaborators Special thanks to our co-researchers: - Dr. Ronald H. Atwell, Director of Student Development and Enrollment Services Office of Assessment and Planning - Dr. Morgan C. Wang, Professor of Statistics and Actuarial Science and Director of the University of Central Florida Data Mining Program - For more information about this program, please visit: http://dms.stat.ucf.edu/