Download
1 / 20
200 likes | 331 Views
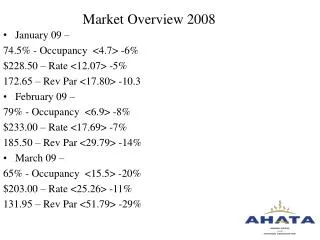
Occupancy Chargeback an overview of different models and a glimpse of ‘one’ future. ATEM-AAPPA 2000 Conference: Concurrent session 2, Stream 5 - Buildings b: Monday 25th September 2000. What is driving the move to Chargeback ?. 1. Government.

E N D
Occupancy Chargeback an overview of different models and a glimpse of ‘one’ future ATEM-AAPPA 2000 Conference: Concurrent session 2, Stream 5 - Buildings b: Monday 25th September 2000
What is driving the move to Chargeback ? 1. Government “ Universities should implement a space charging system to act as an incentive to ensure the economical use of existing properties and requests for additional space. In audit opinion, a charging system which seeks to allocate the full cost of space to user departments based on total existing property holdings will achieve the maximum benefits for the University” Victorian Auditor’s General Report, May 1995
What is driving the move to Chargeback ? 2. University Governance Greater emphasis on management, leadership, accountability and financial responsibility within universities This has led to the need to identify & understand the cost drivers within the ‘business’ > to assist strategic decision making > to better inform decisions on fee-paying courses, consultancy, etc. > to enable universities to set their own student fees - should this occur Capital Asset provision and maintenance is the largest non-salary component of overhead activity costs in universities > level of expenditure needs to be related to overall revenues
What is driving the move to Chargeback ? 3. Facilities Management Encourage improved utilisation of space Reduce capital resource requirements Improve the overall quality of accommodation Improve overall accommodation planning Making those occupying space cognizant of the cost of that space Giving control of the resourcing of accommodation to those who are in occupation Client service culture
So a decision is taken to adopt Chargeback …. Where to now ? There are two basic models: 1. Operational Cost Model 2. Capital Cost Model
Operational Cost Model - RMIT Model based on ‘operational costs’ only - it takes the Property Services operational budget ($21m) and allocates this to users (eg. Faculties) Charges are on a rate per m2 based on the area they occupy (UFA) Charge is made up from two elements: - Direct operating costs: eg. cleaning, utilities, direct maintenance - Indirect operating costs: eg. security, gardening, planning, leases Centrally controlled space is charged by an hourly rate to users Charges were initially developed as a ‘flat rate per m2’ differentiated by campus - further stages: differentiation by space type and quality Charges are based as much as possible on a ‘pay as you use’ basis
Operational Cost Model - RMIT Introduced at RMIT as ‘budget neutral’ in the first three years of operation If a Department vacates space they area able to retain those funds If a Department wants additional space, they have to fund the charge Vacant space is an overhead charged to all Departments Single monthly statement is issued with all charges, including user pays charges (eg. key cutting or removals) Variations in level of service required by a client, such as a higher standard of cleaning, is included in a Service Agreement and charged at a higher rate
RMIT ‘Operational Cost Model’ - 2000 Charge per m2 (UFA): Charge Covers City Bundoora Others Direct Cost • Cleaning • Utilities • Maintenance $39.64 $38.06 $15.82 • Security • Gardening • Leases • Admin’ $53.75 $34.50 $25.00 Indirect Cost $93.38 $72.57 $40.82 Total Space Charge
RMIT ‘Operational Cost Model’ - SWOT Strength Opportunity • Introduced without major disruption • Education and cultural change • has largely been achieved • Service delivery focus established • Property Services operations re- • aligned on ‘client service’ basis • Highlighted ‘hidden’ subsidisation • issues • Offers response to tight budgets • Assists in moves to establish total cost of • delivery • Support for Chargeback well established - can • now move to further development/enhancement • Introduction of ‘Capital Costs’ possible • Need for better utilisation and use of space • accepted Weakness Threat • Did not provide high incentives for • more efficient use of space • Capital costs not addressed • Service standards are ‘benchmarks’ • no punitive damage or quality • improvement provided for • Due to financial process - control still • perceived as being vested in Property • Services group • Little real impact on utilisation • Can become too bureaucratic • Can be seen as political rather than practical • Loss of ownership if cultural/structural issues • not addressed • Potential to become dollar driven rather than • service driven • Perceived by some to be against the cultural • tradition of a University • Stimulates demand for access to quality • facilities
Capital Cost Model Capital Cost Models use portfolio valuation and/or capital replacement costs as a basis in calculating an ‘opportunity cost’ for the space being occupied by a Department Eg. Capital $2,200 m2 Replacement Cost Interest rate 7.00% -------------------------------------------------- Opportunity Cost $154.00 m2
Capital Cost Model Capital Cost model is normally used in conjunction with the Operating Cost model to identify the ‘full cost’ of providing accommodation Eg: Operating Cost $ 75.00 m2 Capital Cost $154.00 m2 -------------------------------------------------- Full Cost $229.00 m2
Capital Cost Model Strength Opportunity • Covers full-cost • Provides high incentive for more • efficient use of space • Similar to ‘commercial’ environment • Subsidisation level fully exposed • Requires differentiation between space types • and quality • Supports drive for quality • Supports Capital Investment decisions Weakness Threat • Radical change from current practice • at most Australian universities • Danger of over-pricing of space • Seen by users as ‘commercial’ may stimulate • demand for punitive damages by client for • poor service performance • Likely to stimulate demand for quality space • that may outstrip ability to provide
In summary …. What decisions need to be taken ? 1. Basis for calculation of the charge: > Operational - based on recovery of costs such as utilities, services, etc. > Capital - based on ‘cost of space’ - similar to commercial lease > Combination of the above 2. Method of charging: > Flat rate per m2 regardless of use, space type or quality > Weighted rate based on space type, eg. lab, office, classroom > Weighted rate based on quality, eg. new high quality building > Combination of the above
In addition …. What else is needed to support Chargeback ? Service Agreements negotiated with clients and detail standard of service to be provided by Property Services, eg: > bins emptied daily > no lift out of action for more than 24hrs unless a major failure Major cultural change - Property Services was restructured Central Service Desk and Client Relations Managers established to act as main point of contact and ensure client satisfaction BIEMS implemented to track and record all works requests, response and completion times - monitor performance Required development of complete and accurate space database and associated CAD drawings Extensive utilisation studies undertaken
The future ? “To ensure the cost information needs of universities are kept current as strategies change to meet competitive pressures and opportunities, the framework for cost management needs to be continuously challenged. Institutions and their leaders need to understand how they create, maintain or destroy value by their decisions and actions.…. Structuring information in an organised and methodical manner should assist all university staff to better understand their actions and decisions by focusing attention on those activities that create economic value ” DETYA ABC Pilot Study at RMIT University, June 1999 Ernst & Young
Activity Based Costing • What is Activity Based Costing ? • Study undertaken by the University focussed on those costs • associated with the use and maintenance of all property, buildings • and grounds • 46 activities were identified at high level • ABC can provide an effective cost management tool • ABC methodology identifies resources, activities and costs objects
Activity Based Costing Resource: Salaries & Wages > salaries > Salaries on-costs > salary related expenses Operating Costs > communication > equipment > printing & stationary etc. Capital > equipment/plant > buildings & infrstructure Activity: Direct > cleaning > utilities > maintenance Indirect > security > gardening > admin’ etc. Capital > opportunity cost > maintenance > refurb’ & upgrades Cost Object: City campus Bundoora campus Other…. # General space types eg. lab, office, classroom, ancillary, etc. - cost m2 per annum
Conclusion Chargeback gives the ‘controlling hand’ to clients in terms of quality, cost effectiveness and determination of ‘client satisfaction’ Facilities provision and academic planning should be much more closely aligned under Chargeback Potentially Cost Centres will be able to redirect former facility operating costs into other areas of their operation There is a risk - facility groups may be required to operate with possibly significantly reduced funds (international experience has shown this to be sometimes the case) Expectation that total space provided will decline over time, utilisation rates will improve, and that the quality of the remaining space will improve