Download
1 / 51
520 likes | 674 Views
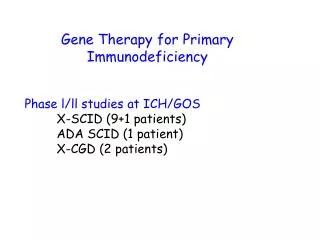
The Social Complexity of Immigration and Diversity (SCID). Nick Shryane (nick.shryane@manchester.ac.uk). Funding. Five-year programme grant from the EPSRC , part of their Complexity Science for the Real World initiative

E N D
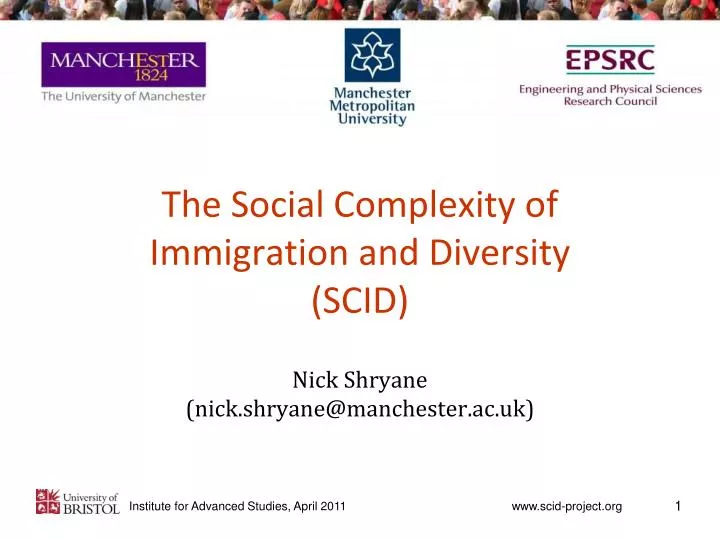
The Social Complexity of Immigration and Diversity(SCID) Nick Shryane (nick.shryane@manchester.ac.uk)
Funding • Five-year programme grant from the EPSRC, part of their Complexity Science for the Real World initiative • “...to develop and apply the tools and techniques of complexity science for tackling major societal research challenges.”
Theoretical Physics Group Centre for Policy Modelling Institutional partners
Research team • Complexity Science • The Centre for Policy Modelling (MMU) • Researching complexity science and social simulation since 1992 • Bruce Edmonds • Ruth Meyer • Theoretical Physics Group (UoM) • Part of the School of Physics and Astronomy • Alan McKane • Tim Rogers
Research team • Social Science • The Institute for Social Change (UoM) • Interdisciplinary social science research centre • Nick Crossley (Sociology DA) • Ed Fieldhouse (PI) • Laurence Lessard-Phillips • Yaojun Li • Nick Shryane • A. N. Other
SCID aims • New methods for complexity science • Integrating analytic and descriptive approaches at different levels of abstraction • New social theory • Linking micro- and macro-processes • Informing policy-makers
Example analytical model • ‘SIR’ epidemic model (Kermack & McKendrick, 1927) • Few parameters • Known causal structure • Clear interpretation • Simple, deterministic, solvable dynamics • Where the simplifying assumptions are reasonable, good fit to data, e.g. Measles • Not so good for other diseases, e.g. HIV/AIDS Susceptible β Infected γ Recovered
Example analytical model Source: wikimedia commons
Complex analytical model SIR model is non-linear, but does not show particularly complex dynamics Even very simple models, though, may exhibit seemingly random, chaotic dynamics Logistic map xn+1 = 4xn (1-xn)
Example descriptive model • Alam, Meyer & Norling (2007) The impact of HIV/AIDS in the context of socioeconomic stressors: an evidence-driven approach. JASSS • Agent-based model of spread and impact of HIV/AIDS in a South African region • Dozens of parameters • Agents are born, age and die; have jobs, receive pensions and grants; have friends, family, sexual partners; marry and divorce; have health statuses, food intake, may have HIV. • Many rules govern the dynamics of all of the above.
Death of a household head When Hilda died of AIDS, she was 62 years old. As a head of household, she was a member of a burial society, which paid out 360 Rand to her family. This didn't cover the funeral costs of 4217 Rand at all. Relatives and neighbours attended the funeral and contributed to the costs in varying degrees, up to the sum of 1339 Rand. This left the household with costs of 2518 Rand to pay on their own. Her 36-year-old son Honest followed her as the head of household. He decided to carry on membership in the burial society and joined it directly after the funeral. *** TICK 189 *** person-2 (female) DIED AT AGE 62 OF AIDS was head of household-1 person-2 had 10 friends person-2 had 29 relatives in 5 households (including own) person-7 (male, 36) becomes new head of household-1 burialSociety-0 pays out 360.0 Rand to household-1 for the death of its member person-2 household-0 contributes 20.0 to burial costs of related household-1 household-2 contributes 20.0 to burial costs of related household-1 household-3 contributes 80.0 to burial costs of related household-1 household-23 contributes 879 to burial costs of related household-1 household-19 contributes 10.0 to burial costs of neighbour household-1 … *** TICK 190 *** household-1 pays 4217 for burial of person-2 person-7 joins burialSociety-0 HIV/AIDS prevalence Sexual network
Example descriptive model • A data integration model • Combines qualitative and quantitative data from many different sources into one model • Includes many different causal structures, feedback loops, stochastic elements • Difficult to fully understand let alone mathematically describe and analyse
KISS vs. KIDS • KISS (Keep it Simple, Stupid) • Models should be simple enough to understand and check (rigour) • May omit critical aspects of the system of interest (lack of relevance) • KIDS (Keep it Descriptive, Stupid) • Models should capture the critical aspects of social interaction (relevance) • They may be too complex to understand and thoroughly check (lack of rigour)
KISS vs. KIDS • KISS (Keep it Simple, Stupid) • Strong inferences possible about within-model processes • Weak mapping to the thing being modelled • E.g. Ideal gas law • KIDS (Keep it Descriptive, Stupid) • Weak inferences about within-model processes • Clear mapping to the thing being modelled
Chains of models SCID will develop “chains” of explicitly related models at different levels of abstraction, bridging the gap from evidence up to theory in a series of smaller, less ambitious jumps...
Modelling strategy Analytic Model SNA Model Abstract Simulation Model 1 Abstract Simulation Model 2 Data-Integration Simulation Model Micro-Evidence Macro-Data
Project flowchart = 1/3rd done
Immigration and diversity • UK has never seen higher levels of immigration and ethnic diversity • Rise of racist political parties and organisations • But also rise in ethnic inter-marriage, tolerance and acceptance of diversity
Immigration and diversity • These issues seem to be rooted in beliefs about ethnicity and national identity, but can’t be divorced from • Social class • Education • Economic competition • Geographical and social segregation • Institutional structures and penalties
Social science themes • Diversity, Homophily & Trust • What factors underlie and influence perceptions and feelings of ‘us’ and ‘them’ • How does this affect : • the construction and operation of social networks • Norms of trust and reciprocity
Social science themes • Political participation • How do diversity and immigration influence the behaviour of • Individuals • Political parties • Key outcomes • Electoral turnout • Party / issue choice
Social science themes • Socio-economic integration • How do processes resulting from immigration and diversity affect finding and gaining employment? • Multiple, overlapping social networks • Homophily and migration limit network size and heterogeneity • Effects of diversity on trust and tolerance under conditions of economic adversity
Household effect on voting Assuming independent choices
Household effect on voting Actual 2001 UK election data Source: Cutts & Fieldhouse 2009, Am J PolSci
Household effect on voting Source: Cutts & Fieldhouse 2009, Am J PolSci
Data integration model of voting • Agent based simulation model • Agents have characteristics, e.g. age, party affiliation, ethnicity, memory. • Agents have behaviours, e.g. voting, discussing politics, making friends. • Households • Every agent belongs to a household. • Networks • Agents are linked to a varying number of other agents.
ABM dynamics • Household dynamics • Households form (‘marriage’, ‘immigration’), change (‘birth’, ‘death’, ‘kids moving out’) and dissolve (‘divorce’, ‘emigration’, ‘death’). • Network dynamics • Friendships/associations form and dissolve, influenced by • Characteristics in common (‘homophily’). • Activities in common. • Friends in common.
ABM dynamics • Voting dynamics • Every Nth timestep, agents may vote or abstain, influenced by: • The voting behaviour of their cohabiters and friends (‘conformity’, ‘norms’, ‘reaction’). • Their past history of voting (‘habit’). • Their interest in the outcome (‘rational-choice’). • Their desire to communicate / influence others (‘expression’)
Narrative voting “stories” I voted for party X because it will put limits on immigration. “I voted for minor party Y because I wanted to send a message to those lying, cheating, fiddlers in Westminster.” I always vote – it’s part of who I am. I didn’t vote – what’s the point? Was there an election on?
Analysing and simplifying • After verifying and validating descriptive ABM, we will seek to “model the model” • which elements of model are ‘important’? • which bits are sensitive to variations in parameter choices? • Aim to produce more abstract, targeted ABMs of specific dynamics, and then analytic models
Schelling model of segregation • Schelling, (1969) – simple agent-based model • An equal number of agents of types A and B are placed randomly on a grid, leaving a small fraction of spaces empty. • An agent is unhappy if fewer than d of the eight squares surrounding it contain agents of the same type. • Unhappy agents take turns to move themselves to vacant squares in which they would be happy. • Even with low values of d, agents segregate themselves into homogeneous groups
Schelling model of segregation Time = 0 d = 3
Schelling model of segregation Time = 10 d = 3
Schelling model of segregation Time = 100 d = 3
Analysing the Schelling model • Hundreds of variants studied over the years, with different: • Network structures • Satisfaction functions • Movement functions • Initial conditions • In nearly all cases, analysis is by simulation because the maths is too hard • Can the key emergent properties be produced by a simplification of the model, one more amenable to mathematical analysis?
Analysing the Schelling model • Simplified network • Each agent has one neighbour • No vacancies • At each timestep one of two things can happen • Segregate, with probability a • Integrate, with probability b
Analysing the Schelling model • Comparing simplified analytical model with four variants of the Schelling model Timestep (x) against Interface density (y). Interface density = fraction of A-B edges. Red lines show analytical model. Black dots show simulations.