Download
1 / 119
1.33k likes | 1.69k Views
Digital Image Processing in Frequency Domain. Md. Al Mehedi Hasan Assistant Professor Dept. of Computer Science & Engineering RUET, Rajshahi. How con we connect broken text ?. How can we remove blemishes in a photograph?. How can we get the enhanced image from the original image?.

E N D
Digital Image Processing in Frequency Domain Md. Al MehediHasan Assistant Professor Dept. of Computer Science & Engineering RUET, Rajshahi
How can we get the enhanced image from the original image? Enhanced image
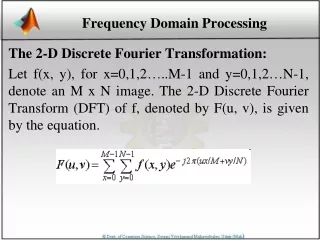
Image transformation What is a transformation? • im is the original image; • IM is the transformed image; • (or ) represents the spatial coordinates of a pixel. Goal of a transformation The goal of a transformation is to get a new representation of the incoming picture. This new representation can be more convenient for a particular application or can ease the extraction of particular properties of the picture.
Point to point transformation • Geometric transformation such as rotation, scaling... • Example of rotation: Remark: a point to point transformation doesn't require extra memory...
Local to point transformation Note that local to point transformation is also called neighborhood operators. Examples of local to point transformation:
Global to point transformation One of the most important transformation is the Fourier transform that gives a frequentialrepresentation of the signal. Fourier series (development in real term): Every periodic signal can be decomposed into a linear combination of sinusoidal and cosinusoidalcomponent functions. and are used to weight the influence of each frequency component.
Why Frequency Domain? Similar jobs can be done in the spatial and frequency domains. Filtering in the spatial domain can be easier to understand. Filtering in the frequency domain can be much faster – especially for large images. Note that convolution in the time domain is equivalent to multiplication in the frequency domain (and vice versa) • When you are faced with a difficult convolution (or multiplication), you can switch domains and do the complement operation
Jean Baptiste Joseph Fourier Fourier was born in Auxerre, France in 1768 • Most famous for his work “La Théorie Analitique de la Chaleur” published in 1822 • Translated into English in 1878: “The Analytic Theory of Heat” Nobody paid much attention when the work was first published One of the most important mathematical theories in modern engineering
Images taken from Gonzalez & Woods, Digital Image Processing (2002) The Big Idea = Any function that periodically repeats itself can be expressed as a sum of sines and cosines of different frequencies each multiplied by a different coefficient – a Fourier series
Sine and Cosine Functions • Periodic functions • General form of sine and cosine functions:
Sine and Cosine Functions (cont’d) • Changing the period T=2π/|α| e.g., y=cos(αt) α =4 period 2π/4=π/2 shorter period higher frequency (i.e., oscillates faster) Frequency is defined as f=1/T Different notation: cos(αt)=cos(2πt/T)=cos(2πft)
Angular Frequency In physics, angular frequency ω is a scalar measure of rotation rate. Angular frequency is the magnitude of the vector quantity angular velocity. One revolution is equal to 2π radians, hence Where ωis the angular frequency or angular speed (measured in radians per second), Tis the period (measured in seconds), fis the ordinary frequency (measured in hertz).
Different Notation of Sine and Cosine Functions • Changing the period T=2π/|α| e.g., y=cos(αt) α =4 period 2π/4=π/2 shorter period higher frequency (i.e., oscillates faster) Frequency is defined as f=1/T Different notation: cos(αt)=cos(2πt/T)=cos(2πft)= where
Different Notation of Sine and Cosine Functions (continue) + + Fundamental Frequency?
Time Domain and Frequency Domain Time Domain: The time-domain plot shows changes in signal amplitude with respect to time. Phase and frequency are not explicitly measure on a time-domain plot. Frequency Domain: The time-domain plot shows changes in signal amplitude with respect to frequency.
Decomposition of a composite periodic signal in the time and frequency domains
Spatial Frequency in image When we deal with a one dimensional signal (time series), it is quite easy to understand what the concept of frequency is. Frequency is the number of occurrences of a repeating event per unit time. For example, in the figure below, we have 3 cosine functions with increasing frequencies cos(t), cos(2t), and cos(3t).
So, we know that a sequence of such numbers gives us the feeling that cos(t) is a low frequency signal. How we can create an image of these numbers? Let scale the numbers to the range 0 and 255: Considering that values are intensity values, we can obtain the following image.
This is our first image with a low frequency component. We have a smooth transition from white to black and black to white. However, it is still difficult to say anything since we have not seen an image with high frequency. If we repeat all the steps for cos(3t) , we obtain the following image: where we have sudden jumps to black. You can try the same experiment for different cosines. By looking at two examples, we can say that if there are sharp intensity changes in an image, those regions correspond to high frequency components. On the other hand, regions with smooth transitions correspond to low frequency components.
We now have an idea for one dimensional image. It is time to switch to two dimensional representation of a signal. Let us first define a kind of two dimensional signal: f(x, y)=cos(kx) cos(ky). For example, the signal for k=1, we have: f(x, y)=cos(x) cos(y).
Our corresponding two dimensional function will be f(x, y)=cos(x) cos(y). How we will obtain a two dimensional image from this function? This is the question! We are going to define a matrix and store the values of f(x,y) for different (x, y) pairs. Basically, we divide the angle range 0-2∏ into M=512 and N=512 regions for x and y, respectively.
Here are images for different k values. Values of k represents the level of frequency (from low to high) for k=0,….,20.
Similar to the 1D case, we can say that if the intensity values in an image changes dramatically, that image has high frequency components.
Special Frequency In Images • Spatial frequency of an image refers to the rate at which the pixel intensities change • In picture on right: • High frequences: • Near center • Low frequences: • Corners
Fourier Series and it’s Derivation According to Fourier, any periodic function defined in can be expressed as Where
Basis, Coordinate Definition A: A set of vectors is a basis of V if it has the following two properties: ( 1 ) S is linearly independent. (2) S spans V. Definition B: A set of vectors is a basis of V if every can be written uniquely as a linear combination of the basis vectors. Let These n scalars are called the coordinates of v relative to the basis S. Thus
Example Consider real space . The following vectors form a basis S of : The coordinates of v = (5 , 3 , 4) relative to the basis S is obtained as follows. Set , that is, set v as a linear combination of the basis vectors using unknown scalars x, y, z. This yields: The equivalent system of linear equations is as follows: The solution of the system is x = 3, y = 2, z = 4. Thus
Inner product Definition An inner product on a real vector spaces V is a function that associates a number, denoted 〈u, v〉, with each pair of vectors u and v of V. This function has to satisfy the following conditions for vectors u, v, and w, and scalar c. 1.〈u, v〉=〈v, u〉 (symmetry axiom) 2.〈u + v, w〉=〈u, w〉+〈v, w〉 (additive axiom) 3.〈cu, v〉= c〈u, v〉 (homogeneity axiom) 4.〈u, u〉 0, and 〈u, u〉= 0 if and only if u = 0 (position definite axiom) 40
Inner product Space, Norm. Metric, Projection Ine Inner Product Space Orthogonal Projection N Norm Metric
ORTHOGONAL SETS AND BASES Consider a set of nonzero vectors in an inner product space V. S is called orthogonal if each pair of vectors in S are orthogonal, and S is called orthonormal if S is orthogonal and each vector in S has unit length. That is:
Orthogonal Basis and Linear Combinations Let S consist of the following three vectors in : we can verify that the vectors are orthogonal; hence they are linearly independent. Thus S is an orthogonal basis of Suppose we want to write v = (7 , 1 , 9) as a linear combination of . First we set v as a linear combination of using unknowns as follows:
Method One Expand (*) to obtain the system Solve the system by Gaussian elimination to obtain , , . Thus
Method Two This method uses the fact that the basis vectors are orthogonal, and the arithmetic i s much simpler. If we take the inner product of each side of (*) with respect to we get Here two terms drop out, since are orthogonal. Accordingly,
Orthogonal Basis and Linear Combinations (continue) Theorem Let be an orthogonal basis of V. Then, for any
Hilbert Space Definition . A Hilbert space H is a vector space endowed with an inner product and associated norm and metric, such that every Cauchy sequence in H has a limit in H. An example of a Hilbert space is the space Definition of . The space is the collection of Borel measurable real or complex valued square integrable functions f on (a,b), i.e.,, endowed with inner product ,and associated norm and metric , respectively, where the integrals involved are Lebesgue integrals.
Basis of a Hilbert space and are examples of finite dimensional Hilbert spaces; that is, any basis will have a finite number of basis vectors (in fact, n of them); expressing a vector in and as a vector in terms of an orthonormal basis is easy. In infinite-dimensional Hilbert spaces, however, such an expression must involve an infinite sum, and hence issues of convergence. To say that for some vectors , we mean that as
Basis of a Hilbert space (con..) Orthonormal System:Let V be an inner product space. A collection of vectors is said to be an orthonormal system if for and if for all . Complete orthonormal system A collection of vectors in a Hilbert space H is complete if for all implies that y = 0. An equivalent definition of completeness is the following. is complete in H if spanis dense in H , that is, given and , there exists such that .
Basis of a Hilbert space (Continue) Definition Let be an orthonormal set in an Hilbert space .Then is said to be an orthonormal basis of if it is a complete orthonormal set in . Theorem Let be an orthonormal set in an Hilbert space . Then is an orthonormal basis if and only if . Theorem Every Hilbert spaces has an orthonormal basis.