Download
1 / 15
150 likes | 154 Views
Understand the purchase habits of Millennial avocado-purchasing households and their role in the growth of the avocado category. This study reveals insights into the high-value segment of Millennial avocado shoppers and provides strategies for expanding sales of Hass avocados.

E N D
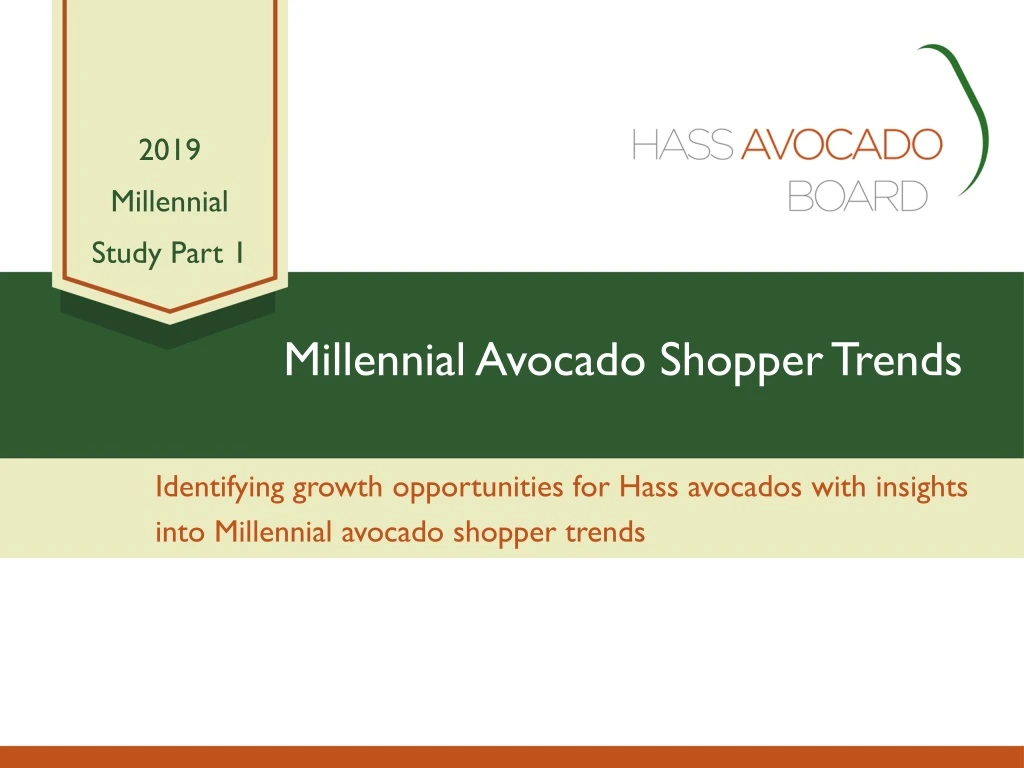
Millennial Avocado Shopper Trends 2019 Millennial Study Part 1 Identifying growth opportunities for Hass avocados with insights into Millennial avocado shopper trends
Objective and Executive Summary Objective The objective of this study is to identify growth opportunities for Hass avocados by understanding the purchase habits of Millennial avocado-purchasing households and the role they are playing in the growth of the category. Executive Summary Millennial households are a high-value segment of the avocado category on a per household basis, displaying avocado purchase behaviors that surpass those of Non-Millennial households. These high-value avocado shoppers account for more than a quarter (27.5%) of avocado-purchasing households and 28.4% of avocado purchase dollars. Millennial households show greater involvement in the avocado category, as a greater proportion of Millennial households purchase avocados compared to Non-Millennial households: In 2018, six out of ten Millennial households purchased avocados, while five out of ten Non-Millennial households made avocado purchases. Millennial households also have a greater proportion of repeat buyers: 80% of Millennial households purchased avocados more than once in 2018, while 77% of Non-Millennial households made multiple purchases. Continued next page…
Executive Summary – Cont. The buying rate* of Millennial households also surpasses the buying rate of Non-Millennial households: In 2018, the Millennial household buying rate ($24.99) was +5% higher than Non-Millennial households. This gap was driven by higher Millennial spend per trip ($3.65 vs. $3.42), but not frequency of purchase. Both segments purchased avocados 6.9 times on average in 2018. However, while Millennials show greater involvement in the category and display purchase trends that surpass those of Non-Millennials, Non-Millennials are catching up. In 2018, Millennial household avocado purchases declined -7%, while Non-Millennial purchases increased +8%. These trends drove a +3.3 point gain in the Non-Millennial household share of avocado purchases, while Millennial household purchase share declined -3.3 points. Penetration and buying rate are two key factors that each played a role in the 2018 shift in purchase shares. Both groups showed an increase in penetration, but Non-Millennial households showed a greater increase (+2.3 pts. vs. +0.3 pts.). Non-Millennial households also showed an increase in buying rate (+3%), while Millennial households showed a decline (-8%). Millennial households are clearly a high-value segment of the avocado category on a per household basis and this study details the avocado purchase behaviors that are driving their impact. However, Non-Millennial households are starting to close the gap as they become more involved in the category. Leveraging the insights in this study can help marketers and retailers enhance strategies aimed at expanding sales of Hass avocados in the marketplace. *Buying rate = Average annual avocado spend per household
Notes This report is Part 1 of a two-part study on the impact of Millennial households in the avocado category. • Part 1 establishes the importance of Millennial households to the category. Millennial households have a disproportionately high impact on the avocado category. This group is more involved in the category (higher penetration) and their annual avocado spend is higher on a per household basis • Part 2 will dive into the Millennial market basket and discover what Millennial and Non-Millennial households are buying with avocados. Look forward to Part 2 for tips on how you can take advantage of these insights to grow your category Data Source: IRI Consumer NetworkTM
A greater proportion of Millennial households purchase avocados vs. Non-Millennial households Millennial Household Penetration 60.1% +0.3 pts. vs. prior year Non-Millennial Household Penetration 51.3% +2.3 pts. vs. prior year Total household penetration = 53.4% (+1.8 pts. vs. prior year) Over 60% of Millennial households purchased avocados in 2018, while slightly more than half (51.3%) of Non-Millennial households purchased avocados during the same period. However, Non-Millennial household penetration is increasing at a faster rate. Household penetration increased slightly for Millennial households (+0.3 pts.), while Non-Millennial household penetration saw a greater increase (+2.3 pts.). Data Source: IRI Consumer NetworkTM 2018 vs. 2017 (All figures are rounded)
Four out of five Millennial avocado-purchasing households purchase multiple times per year A large percentage (79.6%) of Millennial avocado-purchasing households purchase avocados more than once per year. • This Millennial household repeat buyer rate is slightly higher than the Non-Millennial rate (+2.5 points higher) However, the repeat rate is increasing at a faster rate for Non-Millennial households vs. Millennial households (+3.1 vs. +1.2 points, respectively). Data Source: IRI Consumer NetworkTM 2018 vs. 2017 (All figures are rounded)
Millennial households account for more than a quarter of avocado-purchasing households and account for an even greater share of avocado purchases Millennial households account for 27.5% of avocado-purchasing households and an even greater share of avocado purchases (28.4%). • However, Millennials made up a smaller share of avocado-purchasing households in 2018 (-0.9 points vs. 2017) and saw an even more significant decline in their share of avocado purchases (-3.3 points vs. 2017) Data Source: IRI Consumer NetworkTM 2018 vs. 2017 (All figures are rounded)
2018 Millennial household avocado purchases dropped -7% vs. 2017 In 2018, Millennial household avocado purchases declined -7.2% vs. prior year, while Non-Millennial household avocado purchases increased +8.4%. These growth trends drove the change in avocado purchase share from Millennial households (-3.3 pts) to Non-Millennial households (+3.3 pts). Data Source: IRI Consumer NetworkTM 2018 vs. 2017 (All figures are rounded)
Millennial avocado-purchasing households spend more annually on avocados than Non-Millennials, but the gap is shrinking At $24.99 per household, Millennial household average annual avocado spend is +5% higher than the Non-Millennial spend per household ($23.75). However, this gap became smaller in 2018 as Millennial average avocado spend declined (-7.9%) and Non-Millennial average avocado spend increased (+2.6%). Data Source: IRI Consumer NetworkTM 2018 vs. 2017 (All figures are rounded)
Millennial and Non-Millennial households purchase avocados nearly seven times per year on average Millennial and Non-Millennial households purchase avocados 6.9 times per year on average. Trip frequency increased for both Millennial (+9.2%) and Non-Millennial (+13.5%) households, but Non-Millennial trip frequency increased at a faster rate than Millennial households. Data Source: IRI Consumer NetworkTM 2018 vs. 2017 (All figures are rounded)
Millennial avocado-purchasing households spend more per trip than Non-Millennial households Millennial households spend an average of $3.65 per trip on avocados. Non-Millennial spend per trip was -6% lower at $3.42 per trip. Spend per trip declined among Millennial and Non-Millennial households, but Millennial households showed a greater declined in spend per trip (-15.7%) than Non-Millennial households (-9.6%). Data Source: IRI Consumer NetworkTM 2018 vs. 2017 (All figures are rounded)
Millennial and Non-Millennial avocado purchase drivers Millennial Households Non-Millennial Households $453M Avocado purchases -7.2% vs. 2017 $1,142M Avocado purchases +8.4% vs. 2017 $ $ 60.1% Penetration +0.3 points vs. 2017 51.3% Penetration +2.3 points vs. 2017 $24.99 Spend per household -7.9% vs. 2017 $23.75 Spend per household +2.6% vs. 2017 77.1% Repeat buyers +3.1 points vs. 2017 6.9 trips per year +13.5% vs. 2017 $3.42 Spend per trip -9.6% vs. 2017 79.6% Repeat buyers +1.2 points vs. 2017 6.9 trips per year +9.2% vs. 2017 $3.65 Spend per trip -15.7% vs. 2017 Data Source: IRI Consumer NetworkTM 2018 vs. 2017 (All figures are rounded)
Terms and Definitions • Shopper Household Groups • Millennial Households: Head of household born 1981-96 (ages 22-37 in 2018)* • Non-Millennial Households: All other households (18+) • Total Households • Metrics: All figures in this report are rounded • Penetration – Percentage of total households that purchase avocados • Repeat Buyer Rate – Percentage of avocado shoppers that purchase avocados more than once per year • Buyer Rate (Annual Spend per Avocado Household) – Average annual spend on avocados per avocado buying household. Annual Spend = Number of Trips X Spend per Trip • Number of Trips – Average annual avocado purchase occasions per avocado buying household • SpendperTrip – Average avocado dollar spend per purchase occasion • Purchases – Throughout this report, “purchases” refers to dollar purchases. Volume/units/eaches are not available • Time Periods: • Current Year (CY) – 2018 Calendar year • Prior Year (PY) – 2017 Calendar year • Source Data: • IRI Consumer NetworkTM 2018 (Details on page 14) • Fusion Marketing: Study development *http://www.pewresearch.org/topics/millennials/
Data Source: IRI Consumer NetworkTM This report is based on household purchasing data from the IRI Consumer NetworkTM. IRI receives its household purchasing data from the National Consumer Panel (NCP), an operational joint venture by IRI and Nielsen. The NCP is a continuous household purchasing consumer panel that consists of a representative sample of U.S. households who electronically record all purchases. Households are recruited to the NCP and are incented to record all of their purchases, regardless of where purchased, using a handheld in-home scanning device. Household purchasing data complements retail sales data and provides a deeper understanding of category dynamics by focusing on shoppers and their purchase behaviors. In turn, understanding shopper purchase behaviors helps uncover opportunities for growth and aids in effective sales and marketing decisions. In-store purchases Electronically recorded at home
Thank you For additional retail information and insights please visit the Hass Avocado Board website at: hassavocadoboard.com