Download
1 / 79
790 likes | 903 Views
Department of Mathematical Sciences School of Science and Technology . B.A. in Mathematics Education CIP Code: 13.1311 Program Code: 155. Student Learning Outcomes. The following standards, as designated by the NCTM, are used for the Mathematics Education program:

E N D
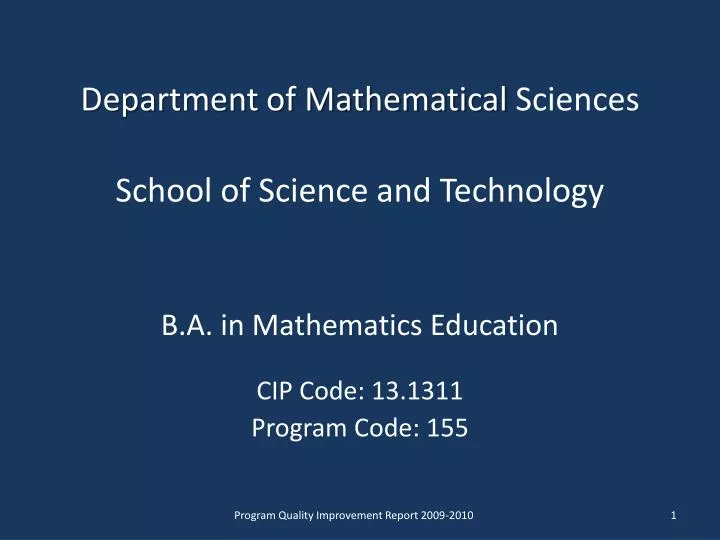
Department of Mathematical SciencesSchool of Science and Technology B.A. in Mathematics Education CIP Code: 13.1311 Program Code: 155 Program Quality Improvement Report 2009-2010
Student Learning Outcomes The following standards, as designated by the NCTM, are used for the Mathematics Education program: Standard 1: Knowledge of Mathematical Problem Solving Standard 2: Knowledge of Reasoning and Proof Standard 3: Knowledge of Mathematical Communication Standard 4: Knowledge of Mathematical Connections Standard 5: Knowledge of Mathematical Representation Program Quality Improvement Report 2009-2010
Standard 6: Knowledge of Technology • Standard 7: Dispositions • Standard 8: Knowledge of Mathematics Pedagogy • Standard 9: Knowledge of Number and Operation • Standard 10: Knowledge of Different Perspectives on Algebra • Standard 11: Knowledge of Geometries Program Quality Improvement Report 2009-2010
Standard 12: Knowledge of Calculus • Standard 13: Knowledge of Discrete Mathematics • Standard 14: Knowledge of Data Analysis, Statistics, and Probability • Standard 15: Knowledge of Measurement • Standard 16: Field-Based Experiences • * All sixteen standards are mandated student-learning outcomes. Program Quality Improvement Report 2009-2010 4
Alignment with Cameron University’s Mission Statements framework which students can acquire the skills and knowledge that will enable them to become highly qualified mathematics secondary teachers promote and establish excellent working relations with all departments in the university optimizes the goals from all the mission statements including the University, School of Science and Technology, and the Department of Mathematical Sciences highest quality of education possible enhances the opportunities for students to make meaningful contributions to the community Program Quality Improvement Report 2009-2010
Candidates will: • receive the highest quality education • become fully qualified to teach mathematics in the secondary schools • interact with the community in the form of field-based experiences • become effective teachers of mathematics • strengthen connections with the community Alignment with Cameron University’s Strategic Plan 2013 Program Quality Improvement Report 2009-2010
Program Direct Measures of Student Learning Assessment # 1 Oklahoma Subject Area Test (OSAT) for Advanced Mathematics Assessment # 2 Major Field Achievement Test (MFT) in Mathematics Assessment # 3 Lesson Plans Assessment # 4 Student Teaching Evaluations Assessment # 5 Teacher Work Sample (TWS) Assessment # 6 Mid-level Assessment Exam Assessment # 7 Mathematical Proof Portfolio Assessment # 8 Technology Portfolio Program Quality Improvement Report 2009-2010
Shortfalls in Student Learning Program Quality Improvement Report 2009-2010
Midway Check Check candidates progress on the following: Mid-level Assessment Grade Point Average (at least 2.5) Grades of C or better in math courses Oklahoma General Education Test (OGET) Teacher education admission Program Quality Improvement Report 2009-2010
Program Actions Since Fall 2009 Last year’s action plan: Develop a technology portfolio Add an induction proof of a recursive relation to the mathematical proof portfolio Realign the lesson plan format Develop a pretest for MATH 2215 Calculus I Collect more data Last year’s PQIR presentation focused on three standards: Standard 2: Knowledge of Reasoning and Proof Standard 6: Knowledge of Technology Standard 13: Knowledge of Discrete Mathematics Program Quality Improvement Report 2009-2010
Standard 2: Knowledge of Reasoning and ProofLearning Outcomes 2.1 Recognize reasoning and proof as fundamental aspects of mathematics. 2.2 Make and investigate mathematical conjectures. 2.3 Develop and evaluate mathematical arguments and proofs. 2.4 Select and use various types of reasoning and methods of proof. Program Quality Improvement Report 2009-2010
Standard 2: Knowledge of Reasoning and ProofAssessments Oklahoma Subject Area Test in Advanced Mathematics Mid-level Assessment Exam Mathematical Proof Portfolio Technology Portfolio Program Quality Improvement Report 2009-2010
* Weighted Mean for tests given on 4/18/2009 and 5/30/2009. Total state tests given = 59 Program Quality Improvement Report 2009-2010
Trend Analysis of Assessment Data OSAT Two mathematics education majors took the OSAT during the AY 2008-2009. There were no mathematics education candidates who took the OSAT during the AY 2009-2010. Both candidates exceeded standards in Mathematical Processes and Number Sense. No Trend Analysis can be done at this time. Program Quality Improvement Report 2009-2010
Trend Analysis of Assessment Data Mid-level Assessment Exam During the Fall semesters of 2007-2009, the Mid-level Assessment Exam was administered to five mathematics education candidates. For Standard 2, one candidate did not meet standards while the other candidate exceeded standards in the Fall 2007. The mathematics education candidate taking the exam in the Fall semester of 2008 met only Standard 2. For Standard 2, one mathematics education candidate met standards and one candidate exceeded standards in the Fall 2009. Due to the small number (n = 5) of mathematics education candidates taking the Mid-level Assessment Exam, a definitive conclusion cannot be drawn at this time nor can trend analysis be conducted. Program Quality Improvement Report 2009-2010
* percentages may not add up to 100 due to rounding Program Quality Improvement Report 2009-2010
Trend Analysis of Assessment Data Mathematical Proof Portfolio Two mathematics education candidates submitted mathematical proof portfolios for evaluation during the Spring 2009 semester. In the proof by Contradiction and Proof Evaluation categories both candidates exceeded standards. In the Proof by Induction category both candidates met standards In the Direct Proof category one candidate exceeded standards and the other met standards. There were no mathematics education candidates who completed the proof portfolio during the AY 2009-2010. The sample (n=2) is statistically insignificant, and a definite conclusion cannot be drawn nor can a trend analysis be completed. Program Quality Improvement Report 2009-2010
Trend Analysis of Assessment Data Technology Portfolio The technology portfolio replaced the upper-level assessment during AY 2009-2010. No students were enrolled in MATH 4772 (Teaching of Secondary Mathematics) during AY 2009-2010 thus no data was collected. Program Quality Improvement Report 2009-2010
Standard 6: Knowledge of TechnologyLearning Outcomes 6.1 Use knowledge of mathematics to select and use appropriate technological tools, such as, but not limited to, spreadsheets, dynamic graphic tools, computer algebra systems, dynamic statistical packages, graphing calculators, data-collection devices, and presentation software. Program Quality Improvement Report 2009-2010
Standard 6: Knowledge of TechnologyAssessments Lesson Plans Student Teaching Evaluation Teacher Work Sample Technology Portfolio Program Quality Improvement Report 2009-2010
* percentages may not add up to 100 due to rounding Program Quality Improvement Report 2009-2010
Trend Analysis of Assessment Data Lesson Plans There were no mathematics education candidates who completed lesson plans during AY 2009-2010. The sample (n=2) is statistically insignificant, and a definite conclusion cannot be drawn nor can a trend analysis be completed. Program Quality Improvement Report 2009-2010
* percentages may not add up to 100 due to rounding Program Quality Improvement Report 2009-2010
*Percentages may not add up to 100 due to rounding. Program Quality Improvement Report 2009-2010
Trend Analysis of Assessment Data Student Teaching Evaluation Two mathematics education candidates completed student teaching during AY 2009-2010 . For Standards 6, candidates met standards approximately 28% of the time and exceeded standards approximately 72% of the time. The sample (n=2) is statistically insignificant, and a definite conclusion cannot be drawn nor can a trend analysis be completed. Program Quality Improvement Report 2009-2010
Trend Analysis of Assessment Data TWS One mathematics education candidate completed a Teacher Work Sample during AY 2009-2010. The one mathematics education candidate who completed Standard 6 exceeded standards. The sample (n=2) is statistically insignificant, and a definite conclusion cannot be drawn nor can a trend analysis be completed. Program Quality Improvement Report 2009-2010
Trend Analysis of Assessment Data Technology Portfolio The technology portfolio replaced the upper-level assessment during AY 2009-2010. No students were enrolled in MATH 4772 (Teaching of Secondary Mathematics) during AY 2009-2010 thus no data was collected. Program Quality Improvement Report 2009-2010
Standard 13: Knowledge of Discrete MathematicsLearning Outcomes 13.1 Demonstrate knowledge of basic elements of discrete mathematics such as graph theory, recurrence relations, finite difference approaches, linear programming, and combinatorics. 13.2 Apply the fundamental ideas of discrete mathematics in the formulation and solution of problems arising from real-world situations. 13.3 Use technological tools to solve problems involving the use of discrete structures and the application of algorithms. 13.4 Demonstrate knowledge of the historical development of discrete mathematics including contributions from diverse cultures. Program Quality Improvement Report 2009-2010
Standard 13: Knowledge of Discrete MathematicsAssessments Oklahoma Subject Area Test for Advanced Mathematics Major Field Achievement Test in Mathematics Mathematical Proof Portfolio Technology Portfolio Program Quality Improvement Report 2009-2010
*Weighted Mean for tests given on 4/18/2009 and 5/30/2009. Total state tests given = 59 Program Quality Improvement Report 2009-2010
Trend Analysis of Assessment Data OSAT Two mathematics education majors took the OSAT during the AY 2008-2009. One candidate exceeded standards in Probability, Statistics, and Discrete mathematics. One candidate did not meet standards in Probability, Statistics, and Discrete mathematics. There were no mathematics education candidates who took the OSAT during the AY 2009-2010. No Trend Analysis can be done at this time. Program Quality Improvement Report 2009-2010
* percentage may not add up to 100 due to rounding Program Quality Improvement Report 2009-2010
Trend Analysis of Assessment Data Major Field Achievement Test There were no candidates who took the Major Field Achievement Test during AY 2009-2010. The sample (n=3) is statistically insignificant, and a definite conclusion cannot be drawn nor can a trend analysis be completed. Program Quality Improvement Report 2009-2010
* percentage may not add up to 100 due to rounding Program Quality Improvement Report 2009-2010
Trend Analysis of Assessment Data Mathematical Proof Portfolio No data has been collected for Standard 13 for Proof by Induction (recursive relation was added Fall 2009). There were no mathematics education candidates who completed the proof portfolio during the AY 2009-2010. Program Quality Improvement Report 2009-2010
* percentage may not add up to 100 due to rounding Program Quality Improvement Report 2009-2010
Trend Analysis of Assessment Data Technology Portfolio The technology portfolio replaced the upper-level assessment during AY 2009-2010. No students were enrolled in MATH 4772 (Teaching of Secondary Mathematics) during AY 2009-2010 thus no data was collected. Program Quality Improvement Report 2009-2010
Program Priority Learning Outcomes for Current Year Standard 1: Knowledge of Mathematical Problem Solving Standard 3: Knowledge of Mathematical Communication Standard 6: Knowledge of Technology Program Quality Improvement Report 2009-2010
Standard 1: Knowledge of Mathematical Problem Solving Program Quality Improvement Report 2009-2010
Program objective and measurement (Create separate chart or table for each priority objective) Program Quality Improvement Report 2009-2010 46
Program objective and measurement (Create separate chart or table for each priority objective) Program Quality Improvement Report 2009-2010 47
Display of Assessment Data – OSAT *Weighted Mean for tests given on 4/18/2009 and 5/30/2009. Total state tests given = 5 Program Quality Improvement Report 2009-2010
Display of Assessment Data – OSAT (continued) *Percentages may not total 100% due to rounding. Program Quality Improvement Report 2009-2010
Display of Assessment Data – MFT *Percentages may not add up to 100 due to rounding. Program Quality Improvement Report 2009-2010