Download
1 / 9
90 likes | 372 Views
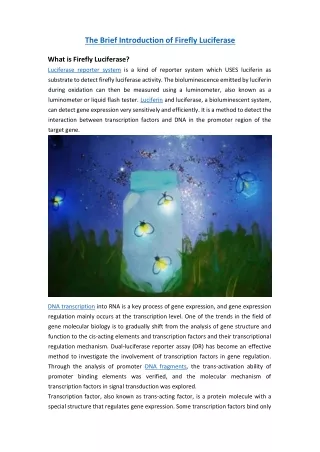
Genetic Screens in Arabidopsis: Luciferase screening for gene discovery. Signals. Signal transduction. Fire-fly luciferase. luciferin. luciferase. Light. CCD camera. Defence Signalling in Plants. Biotic. Viruses, Bacteria, fungi. Hormones. Transcription Factors (>500).

E N D
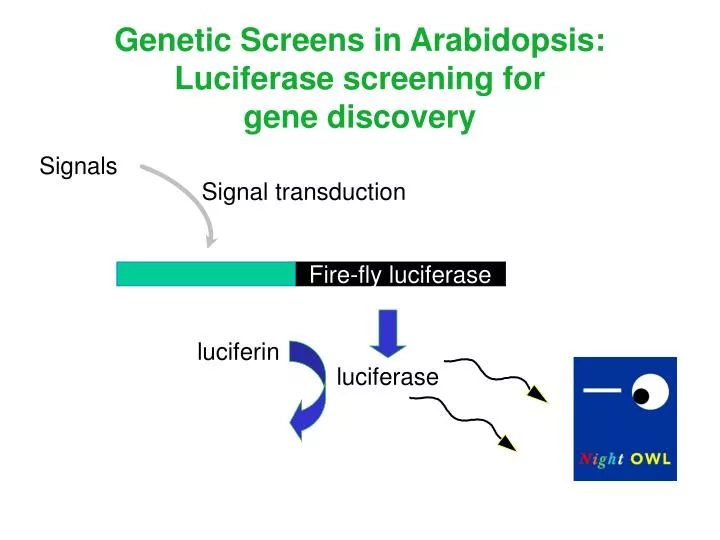
Genetic Screens in Arabidopsis: Luciferase screening for gene discovery Signals Signal transduction Fire-fly luciferase luciferin luciferase Light CCD camera
Defence Signalling in Plants Biotic Viruses, Bacteria, fungi Hormones Transcription Factors (>500) Defence response
Mutant screening approach Mutagenised population Wild-type -SA Gain of function +SA Loss of function Gain of Function
The pTluc promoter trap vector. A, Restriction map of the pTLuc vector. pg5, promoter of T-DNA gene 5; ori/pBR, replication origin from plasmid pBR322; ApR/bacterial ampicillin resistance marker pAg4, 3' poly(A+) signal sequence of T-DNA gene4; hph, hygromycin phosphotransferase gene; pnos, nopaline synthase promoter; FFluc, firefly luciferase gene; pAE93, 3' polyA region of gene E93. B, Sequence of the right border (RB) region . Position of the T-DNA RB is shown by white letters on black background. Sequences of BamHI and SalI restriction sites are underlined. ATG of the FFLuc reporter gene is boxed. The position of oligonucleotides LC1, LC2, and LC3 is indicated by arrows.
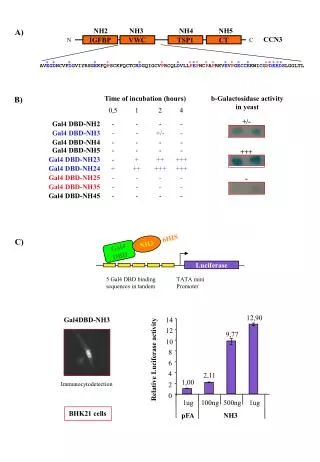
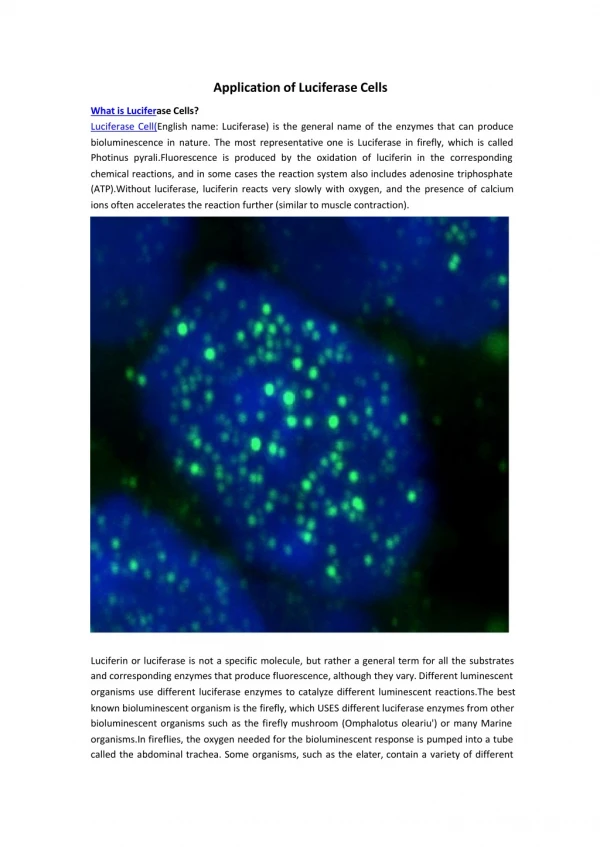
Identification of luciferase gene fusions in the pTluc-transformed Arabidopsis population. A, Light image of 45 screened T1 seedlings. B, Luminescence image of the screened plants. Different patterns of luciferase activity are detectable in three plants. C, Identification of a luciferase gene fusion in pooled seed stocks. Image of 500 screened seedlings. D, Detection of luminescence in the pooled seedlings.
Examples for characteristic luciferase expression patterns in tagged Arabidopsis plants. Images show 3- to 4-week-old plants in light (left) and the corresponding luminescence pattern (right). Colors correspond to increasing luminescence intensity in the following order: blue < green < yellow < red < white. Luminescence patterns: A, constitutive (L3033); B, all green organs (L0213) ; C, petioles and shoot tip (L6180); D, root (L6318); E, shoot apex (L6331); F, young leaves (L6365). G and H, Salt-responsive luciferase activity in T2 plants, which were challenged by high-salt medium. Luminescence was recorded at 0, 2, and 6 h after transfer. G, Salt-induced luminescence in roots (L1518). H, Salt-repressed luminescence (L6177).