Download
1 / 5
50 likes | 55 Views
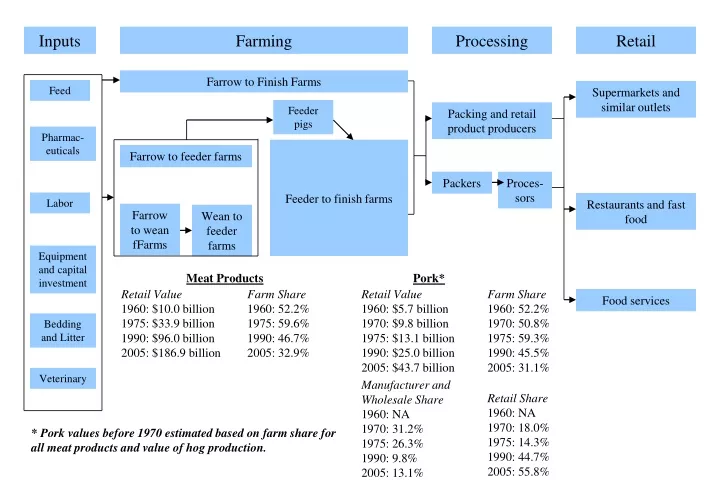
Inputs. Farming. Processing. Retail. Farrow to Finish Farms. Feed. Supermarkets and similar outlets. Feeder pigs. Packing and retail product producers. Pharmac-euticals. Feeder to finish farms. Farrow to feeder farms. Packers. Proces-sors. Labor. Restaurants and fast food.

E N D
Inputs Farming Processing Retail Farrow to Finish Farms Feed Supermarkets and similar outlets Feeder pigs Packing and retail product producers Pharmac-euticals Feeder to finish farms Farrow to feeder farms Packers Proces-sors Labor Restaurants and fast food Farrow to wean fFarms Wean to feeder farms Equipment and capital investment Meat Products Pork* Retail Value1960: $10.0 billion1975: $33.9 billion1990: $96.0 billion2005: $186.9 billion Farm Share1960: 52.2%1975: 59.6% 1990: 46.7%2005: 32.9% Retail Value1960: $5.7 billion1970: $9.8 billion1975: $13.1 billion1990: $25.0 billion2005: $43.7 billion Farm Share1960: 52.2%1970: 50.8%1975: 59.3% 1990: 45.5%2005: 31.1% Food services Bedding and Litter Veterinary Manufacturer and Wholesale Share1960: NA1970: 31.2%1975: 26.3%1990: 9.8%2005: 13.1% Retail Share1960: NA1970: 18.0%1975: 14.3% 1990: 44.7%2005: 55.8% * Pork values before 1970 estimated based on farm share for all meat products and value of hog production.
Inputs Production Processing Retail Farrow to Finish Farms Feed Supermarkets and Similar Outlets 31% (2004)18% (2004)0% (2006) Packing and Retail Product Producers Feeder Pigs 77.8% (1994-96, 1998) Feeder to Finish Farms Farrow to Feeder Farms Pharmaceuticals Packers Processors 45% (2006) Labor Restaurants and Fast Food 17.2% (1994-96, 1998) Equipment and capital investments Farrow to Wean Farms Wean to Feeder Farms 40% (2004)77% (2004)73% (2006) 63% (2006) 99% (2006) Others 7% (2004) Bedding and Litter 5.0% (1994-96, 1998) $7.13 billion (2007, farm to wholesale) 58% (2006)$14.79 billion (2007) $51.70 billion (2007) Legend Red: Proportion of farmsOrange: Proportion of marketed hogsGreen: Proportion of production/consumptionBlue: Value of productionBlack: Proportion of production, contract Veterinary
Prevalence of Contracts Inputs Production Processing Retail Farrow to Finish Farms Feed Supermarkets and Similar Outlets Packing and Retail Product Producers Feeder Pigs Feeder to Finish Farms Farrow to Feeder Farms Pharmaceuticals Packers Processors Labor Restaurants and Fast Food Equipment and capital investments Farrow to Wean Farms Wean to Feeder Farms Others Bedding and Litter Veterinary Legend Red: Contract proportion greater than 50%
Production All Farms Costs: Feed (33%), feeder pigs (32%), labor, hired and unpaid (9%), veterinary and medicine (1.6%); $60.30 per hundred poundsRevenues: Market hogs (68%), feeder pigs (23%), other stock (5%), inventory change and other (4%); $67.41 per hundred pounds Farrow to Finish Farms Costs: Feed (41%), feeder pigs (.2%), labor, hired and unpaid (20%), veterinary and medicine (2.7%); $52.30 per hundred poundsRevenues: Market hogs (90%), feeder pigs (1%), other stock (3%), inventory change and other (5%); $48.38 per hundred pounds Farrow to Feeder Farms Feeder to Finish Farms Costs: Feed (42%), feeder pigs (0%), labor, hired and unpaid (17%), veterinary and medicine (4%); $125.34 per hundred poundsRevenues: Market hogs (0.3%), feeder pigs (93%), other stock (5%), inventory change and other (2%); $109.75 per hundred pounds Farrow to Wean Farms Wean to Feeder Farms Costs: Feed (35%), feeder pigs (42%), labor, hired and unpaid (5%), veterinary and medicine (1%); $50.20 per hundred poundsRevenues: Market hogs (96%), feeder pigs (0.03%), other stock (0%), inventory change and other (4%); $57.60 per hundred pounds Costs: Feed (15%), feeder pigs (62%), labor, hired and unpaid (4%), veterinary and medicine (1%); $135.58 per hundred poundsRevenues: Market hogs (0.08%), feeder pigs (99%), other stock (0%), inventory change and other (1%); $146.88 per hundred pounds Costs: Feed (27%), feeder pigs (0.05%), labor, hired and unpaid (21%), veterinary and medicine (2%); $185.53 per hundred poundsRevenues: Market hogs (0.3%), feeder pigs (93%), other stock (5%), inventory change and other (2%); $240.17 per hundred pounds
Sources • Davis, Christopher G. and Lin, Biing-Hwan. 2005. Factors Affecting U.S. Pork Consumption. United States Department of Agriculture, Economic Research Service, LDP-M-130-01. http://www.ers.usda.gov/publications/LDP/may05/ldpm13001/ldpm13001.pdf