Download
1 / 7
70 likes | 178 Views
APG9ES13: Demonstrate progress in quantifying the key reservoirs and fluxes in the global water cycle and in improving models of water cycle change and fresh water availability. NEWS Objective

E N D
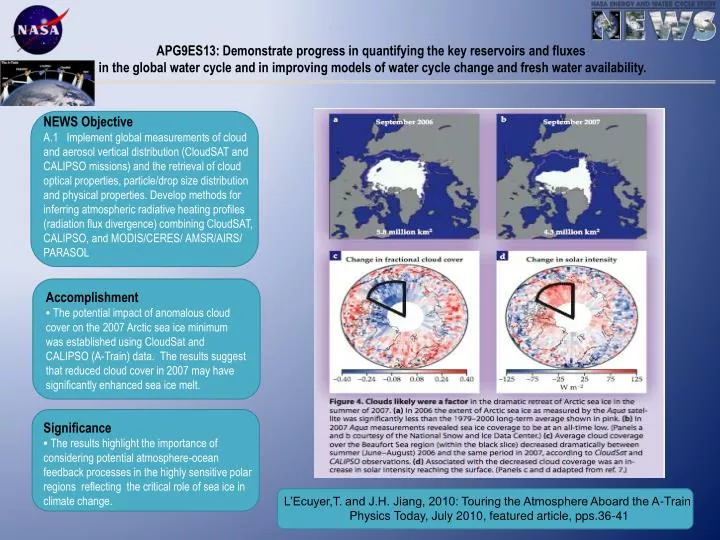
APG9ES13: Demonstrate progress in quantifying the key reservoirs and fluxes in the global water cycle and in improving models of water cycle change and fresh water availability. NEWS Objective A.1 Implement global measurements of cloud and aerosol vertical distribution (CloudSAT and CALIPSO missions) and the retrieval of cloud optical properties, particle/drop size distribution and physical properties. Develop methods for inferring atmospheric radiative heating profiles (radiation flux divergence) combining CloudSAT, CALIPSO, and MODIS/CERES/ AMSR/AIRS/ PARASOL Accomplishment • The potential impact of anomalous cloud cover on the 2007 Arctic sea ice minimum was established using CloudSat and CALIPSO (A-Train) data. The results suggest that reduced cloud cover in 2007 may have significantly enhanced sea ice melt. Significance • The results highlight the importance of considering potential atmosphere-ocean feedback processes in the highly sensitive polar regions reflecting the critical role of sea ice in climate change. L’Ecuyer,T. and J.H. Jiang, 2010: Touring the Atmosphere Aboard the A-Train Physics Today, July 2010, featured article, pps.36-41
APG9ES13: Demonstrate progress in quantifying the key reservoirs and fluxes in the global water cycle and in improving models of water cycle change and fresh water availability. NEWS Objective A.4 - Evaluate the quality of global energy and water cycle datasets and identify important deficiencies or gaps. The accuracy, completeness, and physical consistency of datasets based on operational observations may be evaluated by comparing to short-term experimental satellite measurements, extensive field campaign data (e.g., GEWEX), and reference measurements from surface stations (e.g., ARM, BSRN). This quality assessment may also require technology investments to improve in situ sensors. Accomplishment • A six year analysis of water budget components has been carried out for 10 global basins, with the focus on using remote sensing products. The analysis results in differential weighting of the products depending on their uncertainty and adjustments by the filter to close of the budget indicates the extent which components are adjusted to obtain closure. Significance • This provides the first multi-product budget time series with closure of the global water cycle , allowing for improved estimates that can be used for future diagnostic studies of climate variability. Sheffield, Justin, Eric F. Wood, Francisco Munoz-Arriola, 2010 Long-term regional estimates of evapotranspiration for Mexico based on downscaled ISCCP data, J Hydromet.,; 11: 253-275, April 2010
Zonal and annual mean cloud radiative effect APG9ES13: Demonstrate progress in quantifying the key reservoirs and fluxes in the global water cycle and in improving models of water cycle change and fresh water availability. Left: Cloud radiative effect computed with CALIPSO, CloudSat and MODIS derived cloud properties. Radiative effect is converted to the atmospheric heating rate in K day-1. The value is the average of day and night Aqua overpass time values. Clouds contribute warming near the tropopause over the tropics and cooling lower troposphere in polar regions. NEWS Objective A.1 Implement global measurements of cloud and aerosol vertical distribution (CloudSAT and CALIPSO missions) and the retrieval of cloud optical properties, particle/drop size distribution and physical properties. Develop methods for inferring atmospheric radiative heating profiles (radiation flux divergence) combining CloudSAT, CALIPSO, and MODIS/CERES/ AMSR/AIRS/ PARASOL Accomplishment • New algorithms merge CALIPSO, CloudSat, MODIS, and CERES data, computed heating rate, and produced a new combined data set. One year of merged data (from July 2006 through June 2007, and 8 months in 2008) are now available from Langley ASDC (http://eosweb.larc.nasa.gov/PRODOCS/ceres-news/table_ceres-news.html). Aerosol radiative effect under all-sky conditions Right: Aerosol radiative effect computed with CALIPSO and MODIS derived aerosol properties for April 2007. Aerosols overlapping with clouds are included in the estimate. Uncertainty is large (~100%), however, due to the uncertainty in aerosol optical properties (e.g. single scattering albedo). Significance • Top-of-atmosphere and surface radiative flux (longwave) improvements provided by CALIPSO and CloudSat as well as cloud and aerosol properties are now available . New heating rate profiles with unprecedented vertical resolution and more accurate surface radiative flux have been used to estimate the uncertainty in the surface radiation budget, to determine aerosol and cloud radiative effects in the atmosphere, and in climate process sensitivity studies. Kato, S. S. Sum-Mack, W. F. Miller, F. G. Rose, Y. Chen, P. Minnis, and B. A. Wielicki, 2010: Relationships among cloud occurrence frequency, overlap, and effective thickness derived from CALIPSO and CloudSat merged cloud vertical profile, J. Geophys. Res, 115, D00H28, doi:10.1029/2009JD012277 .
APG9ES13: Demonstrate progress in quantifying the key reservoirs and fluxes in the global water cycle and in improving models of water cycle change and fresh water availability. NEWS Objective A.4 - Evaluate the quality of global energy and water cycle datasets and identify important deficiencies or gaps. The accuracy, completeness, and physical consistency of datasets based on operational observations may be evaluated by comparing to short-term experimental satellite measurements, extensive field campaign data (e.g., GEWEX), and reference measurements from surface stations (e.g., ARM, BSRN). This quality assessment may also require technology investments to improve in situ sensors. Surface Temp. (.15 C/10yr) Water Vapor (~ 7%/C, taking into account MERRA trend bias) Accomplishment • Global observations indicate that warming of surface temperature is not producing increase in global precipitation, but shifts noted with increase in deep tropics, decrease in middle latitudes. ENSO produces a similar small signal in global precipitation variations with regional variations, while global volcano signal is more distinct. Precipitation (~ 0%/C) Surface Temperature, Water Vapor and Precipitation trends Significance • Links between components of the water cycle at various time and space scales important to understanding water and energy processes at various time scales and explaining similarities and differences. These documented variations will serve as benchmarks for reanalysis and improving climate models. Adler, R.F., G. Gu, J.-J. Wang, G.J. Huffman, S. Curtis and D. Bolvin, 2008: Relationships between Global Precipitation and Surface Temperature on Inter-annual and Longer Time Scales (1979-2006). J. Geophys. Res., 113, D22104, doi:10.1029/2008JD010536. Gu, G. and R. Adler, 2010. Precipitation and temperature variations on the inter-annual time scale: Assessing the impact of ENSO and volcanic eruptions. J. Climate (submitted).
APG9ES13: Demonstrate progress in quantifying the key reservoirs and fluxes in the global water cycle and in improving models of water cycle change and fresh water availability. NEWS Objective A.4 - Evaluate the quality of global energy and water cycle datasets and identify important deficiencies or gaps. The accuracy, completeness, and physical consistency of datasets based on operational observations may be evaluated by comparing to short-term experimental satellite measurements, extensive field campaign data (e.g., GEWEX), and reference measurements from surface stations (e.g., ARM, BSRN). This quality assessment may also require technology investments to improve in situ sensors. Accomplishment • Extensive error analyses for global surface radiative flux products including extensive international evaluation has demonstrated adequate accuracy for determining SW diffuse/direct flux ratio and the diurnal variations of the LW fluxes. Significance • It has been determined that the limiting accuracy of surface radiative fluxes now comes from aerosols in the shortwave, not clouds, and from surface temperatures in the longwave, not clouds. An important limitation of surface measured cloud parameters is the inhomogeneous diurnal sampling and the retrieval difficulties with broken clouds (SW) and cirrus clouds (LW). This is a significant step in understanding the role of cloud and aerosol radiation processes in climate. Averaged diuranal cycle of downward longwave radiation from ISCCP, BSRN, ARM and SURFRAD. Zhang, Y.-C., C.N. Long, W.B. Rossow, and E.G. Dutton, 2010: Exploiting diurnal variations to evaluate the ISCCP-FD flux calculations and radiative-flux-analysis-processed surface observations from BSRN, ARM and SURFRAD.J. Geophys. Res., in press, doi:10.1029/2009JD012743.
APG9ES13: Demonstrate progress in quantifying the key reservoirs and fluxes in the global water cycle and in improving models of water cycle change and fresh water availability. NEWS Objective •B.5- Characterize weather-scale and longer-term variations in the global energy and water cycle using available global datasets, investigate possible trends, teleconnections and potential causal relationships and quantify the predictability of energy and water cycle variations on spatial scales, from weather systems to global, and time-averaging periods. This work will yield critical new insights into the performance, strengths, and limitations of individual data sets. Accomplishment • The first global data set that quantifies the monthly distribution of surface water extent at ∼25 km sampling intervals over 12 years has been produced from complementary multiple‐satellite observations. The variability of the surface water extent are compared with related variables such as in situ river discharges, altimeter-derived and in situ rivers/floodplains water level heights and precipitation estimates over inland water bodies and large river basins. In addition to a large seasonal and interannual variability, the new results show a slight overall decrease in global inundated area between 1993 and 2004. Mean surface water extent at annual maximum Significance • Land surface waters play a primary role in the global water cycle and climate. There is a widespread demand for accurate and long‐term quantitative observations of their distribution over the whole globe. This new 12 year (1993–2004) data set of global surface water extent represents an unprecedented source of information for future hydrological or methane modeling. Interannual variations and trends 1993-2004 by latitude bands Papa, F., C. Prigent, F. Aires, C. Jimenez, W. B. Rossow, and E. Matthews (2010), Interannual variability of surface water extent at the global scale, 1993-2004, J. Geophys. Res., 115, D12111, doi:10.1029/2009JD012674. Published 19 June.
APG9ES13: Demonstrate progress in quantifying the key reservoirs and fluxes in the global water cycle and in improving models of water cycle change and fresh water availability. NEWS Objective •B.5- Characterize weather-scale and longer-term variations in the global energy and water cycle using available global datasets, investigate possible trends, teleconnections and potential causal relationships and quantify the predictability of energy and water cycle variations on spatial scales, from weather systems to global, and time-averaging periods. This work will yield critical new insights into the performance, strengths, and limitations of individual data sets. Left: Water vapor partial pressure change per degree of air temperature increase (hPa/°C) versus mean air temperatures for 80 stations for winter (black), spring (green), summer (red), and fall (orange) during 1936–1990. Accomplishment •A relationship between surface air temperature and total precipitable water vapor in historical records and AIRS observations over northern Eurasia has been established. In cold conditions total water vapor follows surface air temperature closely. During warmest conditions total water vapor increases slowly with surface air temperature. Right: Distribution of the rate of change of AIRS total precipitable water with surface air temperature (%/°C) during 2003-2006. Significance • Climate models predict approximately constant relative humidity with temperature. These results show that warmest conditions are associated with lowest relative humidity over Eurasia. This suggests that climate models may be overestimating the strength of water vapor-driven greenhouse warming at high latitudes during summer. Ye, H., and E. J. Fetzer (2009), Atmospheric moisture content associated with surface air temperatures over northern Eurasia, Int. J. Hydrology, in press. **Lead Author Hengchun Ye received the American Association of Geographers Climate Specialty Group John Russell Mather Paper of the Year Award for this study.