Download
1 / 47
470 likes | 595 Views
MODELING AND OPTIMIZATION OF QUALITY CHARACTERTICS FOR THE MICRO-MACHINING OPERATIONS. NATARAJAN U 2009. 06. 26 Kyungpook National University. CONTENTS. OBJECTIVES MODELING AND OPTIMIZATION FOR MICRO-END MILLING PROCESS

E N D
MODELING AND OPTIMIZATION OF QUALITY CHARACTERTICS FOR THE MICRO-MACHINING OPERATIONS NATARAJAN U 2009. 06. 26 Kyungpook National University
CONTENTS • OBJECTIVES • MODELING AND OPTIMIZATION FOR MICRO-END MILLING • PROCESS • MULTI-RESPONSE OPTIMIZATION IN MICRO-EDM PROCESS • USING TAGUCHI QUALITY LOSS FUNCTION AND PRINCIPAL • COMPONENT ANALYSIS(PCA) • ANFIS MODELING FOR THE PREDICTION OF QUALITY • RESPONSES IN MICRO-EDM PROCESS • SCOPE OF FUTURE WORK
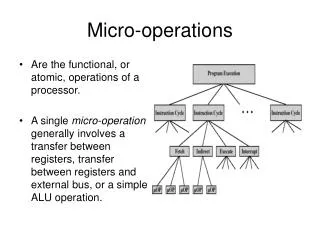
OBJECTIVES • In micro-end milling process, the quadratic models for metal removal rate (MRR) and surface roughness (Ra) were developed and optimized machining parameters were determined using Response Surface Methodology (RSM) • Multi-response optimization in micro-EDM process using Taguchi quality loss function and Principal component analysis (PCA) • In micro-EDM process, an adaptive neuro-fuzzy inference system (ANFIS) model have been developed for the prediction of MRR, Ra and Tool Wear Ratio (TWR)
PROCESS OPTIMIZATION IN MICRO-END MILLING USING RSM PROPOSED METHODOLOGY • Identifying the important process control variables • Finding the upper and lower limits of control variables • Development of design matrix using central composite design and conducting the experiments as per the design matrix • Recording the responses • Development of second order quadratic model • Determining the coefficients of the second order polynomials • Checking the adequacy of the models developed • Testing the significance of the regression coefficients • Presenting the main effects and the significant interaction effects of the process parameters in 2D (contour) and 3D form • Determination of optimized machining process parameters for the multiple responses
TYPES OF 3D RESPONSE SURFACES Maximum Minimum
TYPES OF CONTOUR RESPONSE SURFACES Maximum Minimum
Analysis of variance for main and interaction effects of parameters on MRR
Analysis of variance for main and interaction effects of parameters on Ra
Desirability surface for the cutting speed and feed rate when the depth of cut is 25µm
Bar-graph showing the maximum desirability of 0.8 for the combined objective Overall desirability D =
Ramp diagram with optimized machining parameters and predicted responses
MULTIPLE-QUALITY RESPONSE OPTIMIZATION IN MICRO-EDM USING TAGUCHI QUALITY LOSS FUNCTION AND PCA PROPOSED METHODOLOGY • To identify the signal and noise factors which influence the responses • To determine the type of responses or quality characteristics to be optimized • Smaller-the-better responses • Larger-the-better responses • Nominal is the better responses • To compute the quality loss(QL) for each response • To compute the normalized quality loss (NQL) • Perform Principal Component Analysis(PCA) on the NQL data • To determine the optimal condition • Perform a confirmatory experiment
INPUT PARAMETERS AND OUTPUTS( RESPONSES) Polarity A Peak current Gain B H Metal Removal rate Surface roughness Tool wear ratio Gap Ignition voltage C G Capacitance Pulse on time F Pulse off time D E
S/N RATIO FOR SINGLE OBJECTIVE PROBLEM • S/N ratio (db) = -10 log [ 1/n∑ni (Di2)] ( FOR LOWER-THE-BETTER TYPE ) • S/N ratio (db) = -10 log [ 1/n∑ ni (1/Di2)] ( FOR HIGHER-THE-BETTER TYPE ) where Di is the response value for a trial condition repeated ‘ n’ times.
MULTIPLE SIGNAL-TO-NOISE RATIO for Multiple Objective Problem The Normalized quality loss can be computed as below: yiJ = LiJ / Li* where LiJ=Quality loss for the ith quality characteristic at the jth trial condition Li* = Maximum quality loss for the ith quality characteristic among all the trial conditions The Total Normalized Quality Loss (Yi) Yi = Σik wi yiJ Multiple Signal-to-Noise Ratio(MSNR) = ηJ = -10 log(YJ)
IMPLEMENTATION - Taguchi Quality Loss Method Factors and their Levels
Normalized Quality Loss values of selected Quality characteristics
ANOVA on the Multiple Signal-to-Noise Ratio (MSNR) before Pooling
ANOVA on the Multiple Signal-to-Noise Ratio (MSNR) after Pooling Pure Sum of squares ( S’ ) S’A = SSA – [( DOFA) * Ve ] = 132.467 – [ 1 * 4.2983] = 128.1687 Percentage Contribution PA = S’A / ST = 128.1687 / 303.4606 = 0.4224*100 =42.24 From F-tables: F0.05,2,11 = 3.98 F0.10,2,11 = 2.86 * factor is significant at both 5% and 10% significance levels
PRINCIPAL COMPONENT ANALYSIS -Implementation MINITAB RESULTS EIGEN ANALYSIS OF THE CORRELATION MATRIX Eigenvalue 1.8790 0.8818 0.2392 Proportion 0.626 0.294 0.080 Cumulative 0.626 0.920 1.000 Variable PC1 PC2 PC3 C1 -0.519 -0.705 0.484 C2 0.517 -0.709 -0.480 C3 0.681 0.001 0.732 PCA 1 = -0.519 (MRR) + 0.517 (SR) + 0.681 (TWR)
RESULTS Significant Factors for the Taguchi method: A E D G A - Polartiy E - Pulse off time D - Pulse on time G - Gap Significant Factors for the PCA : A F H C A - Polarity F - Capacitance H - Gain C - Ignition voltage Optimal Settings of Factor Level for Taguchi method : A2-B1-C3-D2-E1-F1-G2-H1 Optimal Settings of Factor Level for PCA method : A1 –B1-C3-D1-E2-F2-G2-H2
ANFIS MODELING FOR THE PREDICTION OF QUALITY RESPONSES MICRO-EDM OBJECTIVE In order to exploit the advantages of both Neural network and the Fuzzy model, this Neuro-fuzzy model has been emerged. ADVANTAGES OF ANFIS METHOD • Handle any kind of information ( Numeric, linguistic etc) • Manage imprecise data • Fast computation • Better flexibility and self-learning
PERFORMANCE OF BP BASED ANN& INITIAL MEMBERSHIP FUNCTION PLOT FOR THE INPUT VARIABLE ‘FEED RATE’ Initial membership function for ‘Feed rate’ Performance of BP based ANN
COMPARISON OF MEASURED AND PREDICTED MRR VALUES Average absolute percentage error 7.19 4.33
COMPARISON OF MEASURED AND PREDICTED Ra VALUES Average absolute percentage error 9.57 7.49
COMPARISON OF MEASURED AND PREDICTED TWR VALUES Average absolute percentage error 10.87 6.37
FUTURE WORKS • In this work, modeling and optimization methods have been applied for micro-end milling and micro-EDM processes. This experimental works can be extended to other machining operations like micro-WEDM, micro-WEDG, micro-ECM, micro-turning etc., • The number of input machining parameters can be extended and hence the data-base be improved by experimentation .to find accurate results • The experiments can be performed with other tool and work-piece material.In micro-end milling process, dynamic parameters can also be included • The parameters used in this micro-EDM process are feed rate, capacitance, gap voltage and threshold values. Other parameters like pulse on-time, pulse off-time etc., can also be considered
WHO IS PROFESSIONAL? • FORMAL TRAINING ( THEORY + PRACTICAL) • SERVING FOR THE SOCIETY • EDUCATION SYSTEM IS REGULATED BY AGENCY LIKE ABET By Charles Fladderman
THREE TYPES OF LEARNING DOMAIN COGNITIVE DOMAIN (MENTAL SKILL OR KNOWLEDGE) AFFECTIVE DOMAIN (EMOTIONAL AREAS) ATTITUTE PSYCHOMOTOR DOMAIN (MANUAL OR PHYSICAL SKILL)
TO BE SUCCESSFUL IN CAREER AND LIFE • LET US TREAT OTHERS IN THE SAME WAY WE WANT TO BE TREATED • YOU ARE OKAY! I AM OKAY! • BALL BAR OKAY! IT IS A GOOD ATTITUTE! • LET US NOT DISCOURAGE OTHERS’ WORK • LET US AVOID ‘ NOT INVENTED HERE ! ‘NOT DONE HERE’ SYNDROME • AGREE THE DISAGREEMENTS ( LETS NOT ARGUE WITH OTHER PEOPLE) • TAKE RISK IN LIFE. REAL RISK LIES IN RISKLESS LIVING
LOVE AND HUMANITY • BE HAPPY AND MAKE OTHERS HAPPY • NO PERSON IS 100% PERFECT, ACCEPT OTHERS AS THEY ARE • WHEN WE MEET OTHER PEOPLE, LET THEM TAKE POSITIVE ENERGY FROM US. LET US DROP SMILE AT OTHERS. SMILE COSTS NOTHING • IF WE KNOW IN ADVANCE THAT OUR LIFE ENDS IN A MONTH, DURING THAT PERIOD WE WILL LOVE ALL HUMAN BEINGS IN THE WORLD IRRESPECTIVE OF OUR MOODS, EGO, COMPETITIVENESS. LET US LOVE PEOPLE ALL THE TIME LIKEWISE LET US CREATE A WIN-WIN SITUATION IN TECHNOLOGY AS WELL AS IN LIFE GOOD LUCK