Download
1 / 16
180 likes | 406 Views
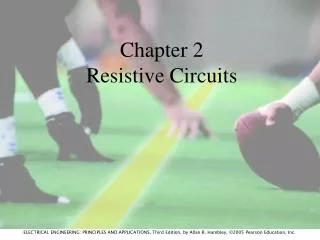
V s (t). 10 V. t (ms). 0. 1. 2. 3. Lecture #20 EGR 261 – Signals and Systems. Read : Ch. 16 in Electric Circuits, 9 th Edition by Nilsson. Circuit Analysis with periodic waveform inputs

E N D
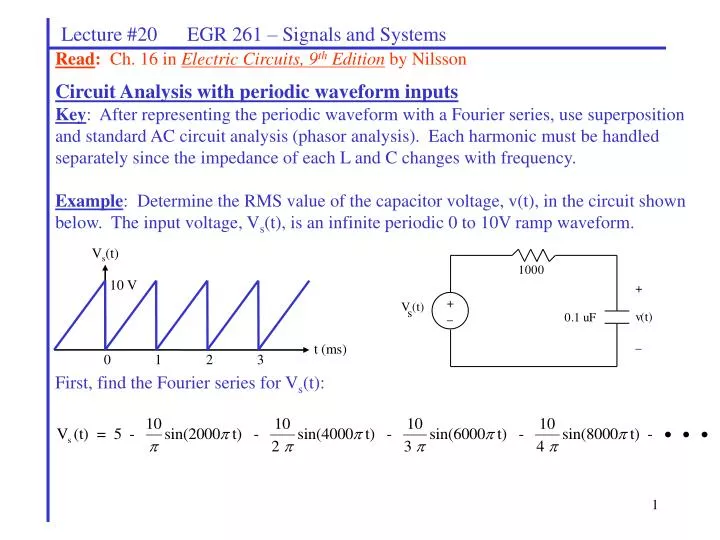
Vs(t) 10 V t (ms) 0 1 2 3 Lecture #20 EGR 261 – Signals and Systems Read: Ch. 16 in Electric Circuits, 9th Edition by Nilsson Circuit Analysis with periodic waveform inputs Key: After representing the periodic waveform with a Fourier series, use superposition and standard AC circuit analysis (phasor analysis). Each harmonic must be handled separately since the impedance of each L and C changes with frequency. Example: Determine the RMS value of the capacitor voltage, v(t), in the circuit shown below. The input voltage, Vs(t), is an infinite periodic 0 to 10V ramp waveform. First, find the Fourier series for Vs(t):
Lecture #20 EGR 261 – Signals and Systems We can now replace the ramp voltage source in the circuit by an infinite number of sinusoidal voltage sources as shown below:
Lecture #20 EGR 261 – Signals and Systems Now using superposition the circuit can be analyzed once for each source with all other sources killed (shorted). Note that the capacitor impedance changes for each circuit. DC source only: (DC component) First harmonic source only: (1st harmonic component)
Lecture #20 EGR 261 – Signals and Systems Second harmonics source only: (2nd harmonic component) Third harmonic source only: (3rd harmonic component)
Lecture #20 EGR 261 – Signals and Systems Fourth harmonics source only: (4th harmonic component) Fifth harmonic source only: (5th harmonic component)
Lecture #20 EGR 261 – Signals and Systems Total capacitor voltage: Recall that (using peak sinusoidal values) In the example above, VRMS can be approximated by using the DC component and the first 5 harmonics as follows:
Lecture #20 EGR 261 – Signals and Systems Example: A) Determine the transfer function H(s) = Vo(s)/Vi(s) for the circuit shown below.
Lecture #20 EGR 261 – Signals and Systems B) Sketch the LM response for H(jw). What type of filter is represented?
v(t) 10 t 0 0.5ms 2ms 2.5ms 4ms Lecture #20 EGR 261 – Signals and Systems C) The following waveform is applied to the circuit. The first four terms of the Fourier series (DC – 3rd harmonic) for the waveform are shown below. D) Use superposition to find Vo for each component.
Lecture #20 EGR 261 – Signals and Systems D) Use superposition to find Vo for each component (continued).
Lecture #20 EGR 261 – Signals and Systems D) Use superposition to find Vo for each component (continued). E) Find the RMS value of Vo.
Lecture #20 EGR 261 – Signals and Systems sinc(x) – an important function in Signals and Systems The function sinc(x), or Sa(x), is sometime referred to as the interpolation function or the filtering function and it is important in the area of signals and systems, particularly when dealing with Fourier transforms and Fourier series. sinc(x) is defined as follows: The graph of sinc(x) is shown below. Note that sinc(x) can be viewed as the product of sin(x) and 1/x.
Lecture #20 EGR 261 – Signals and Systems • Notes on sinc(x): • Sinc(x) = 0 when sin(x) = 0 except at x = 0, • So sinc(x) = 0 for x = ±π, ±2π, ±3π, … • At x = 0, it appears that sinc(x) is undefined; • however, using L’Hospital’s rule: • To clarify the behavior at x = 0, sinc(x) is sometimes defined as: • Also note that |sinc(x)| is another important function (illustrated below).
Lecture #20 EGR 261 – Signals and Systems • Example: Graph the function sinc(3w/7). • Solution: • sinc(x) = 1 at x = 0 • sinc(x) = 0 at x = ±π, ±2π, ±3π, … so the first zero crossing must occur at 3w/7 = π, so w = 7π/3.
v(t) Vm t 0 - /2 /2 T- /2 T+ /2 T Lecture #20 EGR 261 – Signals and Systems Amplitude spectrum for a periodic pulse waveform An important special case to consider is the amplitude spectrum for the periodic pulse waveform shown below. Note that the period is T and the pulse width is . The exponential Fourier series for v(t) is determined below:
Lecture #20 EGR 261 – Signals and Systems Note: We will see a similar amplitude spectrum for a non-periodic pulse using Fourier transforms in the next chapter! Reference: Electric Circuits, 7th Edition, by Nilsson.


![G7 - PRACTICAL CIRCUITS [2 exam question - 2 groups]](https://cdn0.slideserve.com/815450/g7-practical-circuits-2-exam-question-2-groups-dt.jpg)
![G7 - PRACTICAL CIRCUITS [2 exam question - 2 groups]](https://cdn0.slideserve.com/1309220/g7-practical-circuits-2-exam-question-2-groups-dt.jpg)