Download
1 / 14

E N D
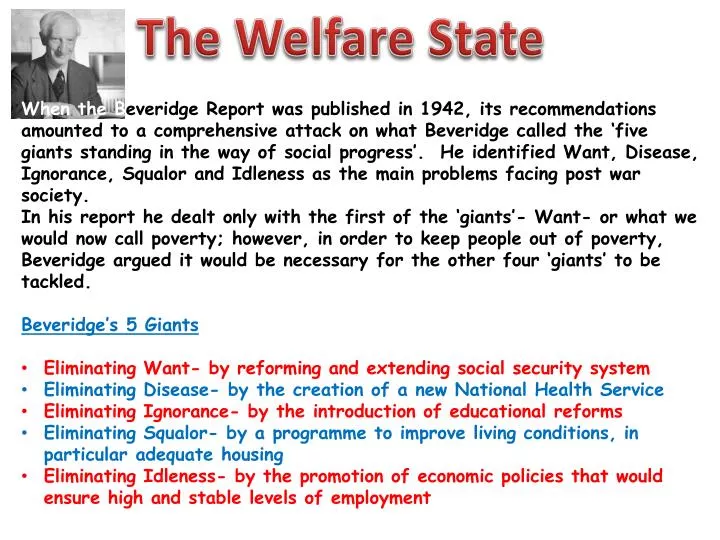
The Welfare State • When the Beveridge Report was published in 1942, its recommendations amounted to a comprehensive attack on what Beveridge called the ‘five giants standing in the way of social progress’. He identified Want, Disease, Ignorance, Squalor and Idleness as the main problems facing post war society. • In his report he dealt only with the first of the ‘giants’- Want- or what we would now call poverty; however, in order to keep people out of poverty, Beveridge argued it would be necessary for the other four ‘giants’ to be tackled. • Beveridge’s 5 Giants • Eliminating Want- by reforming and extending social security system • Eliminating Disease- by the creation of a new National Health Service • Eliminating Ignorance- by the introduction of educational reforms • Eliminating Squalor- by a programme to improve living conditions, in particular adequate housing • Eliminating Idleness- by the promotion of economic policies that would ensure high and stable levels of employment
The four founding principles of the Welfare State Collectivist: The state would fund the services needed. The Govt. raised funds through National Insurance and general taxation. The Treasury decided the levels of pensions and benefits and succeeding governments decided on levels of investment in the NHS, then through local authorities it decided on how much was to be spent on education and social housing. However, the rising costs involved in these services has made successive governments review the way the Welfare State was funded. Politically those on the right argue that too much is spent on the Welfare State and it undermines economic growth and that it forces wage levels up. The left argue that the Welfare state does not give enough to important groups in our society such as women and ethnic minorities. Increasingly aspects of the Welfare State have been devolved away from direct government e.g. PPP, Thatcher years sold of many social houses and students paying Unituition fees. Therefore the welfare system is only partly collectivist.
Universal: The 2nd aim was to provide a range of services for the whole population that was free at the point of need. However, from the beginning this principle was not applied to all provisions. Although universal health care has remained largely free at the point of need, there has been changes made for prescriptions, dental care and eye treatment. Free education up to the age of 16 remains but provisions for places in higher education has now given way to the introduction of tuition fees in England and Wales. Means tested benefits, Pension credits and Working Tax Credits all were given based on income. Child Benefit was a universal benefit but it will now also be means tested as of 2013. Therefore the Welfare State is not universal across all services.
Comprehensive: The state would undertake to provide for all aspects of need. Beveridge wanted the Welfare state to slay the five giants. The extent to which the Welfare State has tackled these evils to varying extents. The creation of the NHS meant a commitment to provide ‘a comprehensive health service for the improvement of the physical and mental health of people …for the prevention of, diagnosis and treatment of illness.’ The NHS has taken on the responsibility for the nations health care and to a great extent has provided increasing levels of prevention and treatment. However, as specialist consultants vary from area to area and some drugs available in some areas and not in others- the postcode lottery- every person does not have equal access to all treatments in all areas of the UK. Issues with council housing accommodation and employment to tackle the other evils have also seem varying success. Therefore the Welfare State is not as comprehensive as Beveridge intended.
Equality: To provide equal provisions for all people in all regions and areas. Yet in the NHS to take one example has also been unequal. From the beginning private health care has always offered more opportunities for those who were wealthiest. In some areas the provision was better than others. For example,an area where there was a teaching hospital would have more experienced specialistsand could provide more treatments. The postcode lottery means that some treatments are available to some people in some areas and not to others. Therefore Welfare is not provided equally in all regions in all areas.
Cameron’s Big Society David Cameron’s idea of a ‘Big Society’ is the view that ‘the British state has become too big, impersonal and monolithic.’ Cameron wishes to reduce the power of central government and for local communities to take greater responsibility in running worthwhile local services such as parks and libraries. His governments inclusive slogan ‘We’re all in this together’ has been criticised as simply covering up public sector cuts. Cameron’s aim of creating a more caring conservatism is being undermined by the many local government cuts. Activity: Read pages 7-14 Explain what the Beveridge report identified and how the Five Giants can be eliminated? Explain the four Founding Principles of the Welfare State. Why might it be argued that the Welfare State has never lived up to these principles? Describe Cameron’s Big Society idea and why it has been criticised. Explain why the NHS has become a “victim of its own success”- include ways of paying for health with pros and cons. Why do Welfare and pensions take up so much of the budget? Refer to the bar charts on p.12 as evidence.
Inequalities in Wealth Poverty- groups vulnerable to poverty: * Minority ethnic groups- the income poverty rate for ethnic groups is about 40% compared to 20% for white British people. There are big differences in poverty rates across ethnic groups. Risks of income poverty are highest for Bangladeshi and Pakistanis but also above average for Indians and Chinese. For all ages, family types and work statuses people from minority ethnic groups are, on average, more likely to be in income poverty than whites, Almost 70% of those in income poverty live in inner London are from minority ethnic groups. Minority ethnic groups are being overlooked for jobs and are being paid less.
Child Poverty- key facts • In 2008-09 2.8 million children were living in poverty. This is about 30% of children. • 2.2 million children (17%) were both low income and material deprivation in 2008-09. • 40% of poor children live in a household headed by a lone parent. However, the majority (57%) live in a household headed by a couple. • 38% of children in poverty are in families with more than 3 children. • 1.9 million children live in workless households. • In 1999 Tony Blair committed to ending child poverty by 2020. This equates to be a government target of 1.7 million to be lifted out of poverty by 2010. However, only 600,000 children were lifted out of poverty between 1998-2008. • Child poverty costs the Exchequer £25 billion each year. • Eradicating child poverty requires action in a wide range of policy areas such as child care, skills, availability and flexibility of jobs, benefits and tax credits. • What are the causes of child poverty? • Worklessness is the key factor leading to child poverty. This is very common among lone parents, with about 2 in 5 not in work. • Three quarters of lone parents who found work escaped poverty after 2 years. • Worklessness is a result of 3 main changes; increase in lone parent families with women heading most of these families; secondly, unemployment levels are rising; thirdly, male inactivity rates have risen substantially, esp for men aged between 25-49.
Policies to deal with inequalities in Wealth • Labour’s strategies to increase levels of employment: • Working Tax Credits • Child Tax Credits • NMW • New Deal • Modern Apprenticeships • To help income levels of those not in work: • JSA • Jobcentre Plus • Pension Credit • Winter Fuel Payment
Inequalities in health • Geographic inequalities • “ Scotland: sick man of the UK with 22 of the top 25 illness areas.” This was the headline in the Herald after a report by Caci (2006) looked at alcohol consumption, smoking, exercise, weight and long term illness and could identify particular streets with a high concentration of unhealthy residents. • Other reports have also highlighted this North/South divide with the main culprit for it being poverty. • Govt. statistics show ‘death rates are highest in Scotland followed by the north and north-west regions of England.’ • Scotland has the highest death rate from lung cancer- almost twice the death rate in the south-west of England. • Life expectancy lower for men and women in Scot. Than Eng and Wales. • Life expectancy gender gap has narrowed across the UK. Over past 27 years it has narrowed from 6.0 to 4.2 years. • Why is this divide happening? • It cannot be explained through a disparity in health care spending and health service employees. Spending on health in Scotland is significantly higher than England, annually more than £200 extra per person. • Scotland suffers from greater social deprivation and has a lower % covered by private health care.
Lifestyle Issues • Social class and obesity: an examination of the socio-economic distribution of people in Britain who are overweight confirms that fat is also a class issue. The lowest social class has levels of obesity that match American levels, while the highest social class has the lowest obesity levels. • In 2008 only 33% of women aged 16 and over took the recommended level of physical activity. Men were better at 45%. • Only 56% of girls under 16 took sufficient levels of exercise. • Lifestyle choices include levels of exercise, diet and eating junk food, alcohol consumption and smoking. • Only one quarter of women ate the recommended 5 a day- again this is affected by income. • Only 13% of women in the least deprived 20% of the population ate 5 a day compared to 28% in the top 20% of the population. • Obesity costs the NHS £457 million every year. The drug bill alone is £5 million with about 12,000 Scots taking obesity drugs. • An estimate of 3400 people in Scotland die due to obesity a year.
Lifestyle and smoking: Smoking is a crucial factor in the ill health of people who live in deprived areas. Smoking is a class issue; • It was not until the 1990’s that this class difference really emerged with professional classes listening to health advice and the number of those who smoked in the top social class has fallen by 75%. • Glasgow had one of the worst records for lung cancer among women. Women are 20 years behind men in their smoking habits when men were struck down with vicious lung cancer years ago the pattern is now moving on. • For women booking into antenatal clinics, 36% of those from the most deprived 20% of the population were smokers compared to 6% in the least deprived 20%.
Government response To health inequalities • Working together for a healthier Scotland • Health targets: Set out when Scot Parl opened. • To reduce premature mortality from coronary heart disease by half and from cancer by 20%, saving the equivalent of more than 2500 lives in Scotland each year. • To cut smoking among 12-15 year olds from 14% to 11% by 2010. Attempts to reduce the proportion of women smoking during pregnancy from 29% to 20%. • Alcohol consumption on the increase- renewed effort to reduce the incidence of en and women exceeding weekly alcohol limits from 33% to 29% and 13% to 11% respectively. Reducing the % of young people drinking from 20% to 16%.
What has been achieved? Smoking ban- March 2006 (England followed in 2007). Those who smoke has decreased from 32% in 1999 to 24% in 2011 (Scottish household survey 2011). Smoking among school aged boys and girls has also decreased. Research carried out by University of Edinburgh found between March 2006 and 2010 the rate of girls smoking fell from 28% to 19%. In September 2011 it was found that Scots giving up smoking had beaten the Scottish Governments target, with 89,075 quitting in the period of 2007-2011. Hungry for Success and Healthy School meal Scheme 2002-10 The then Scot Exec launched its £63.5 million initiative to get school children to switch from junk food to healthy eating. It introduced nutritional standards for school meals in primary and secondary schools. Food or drinks with high salt and sugar contents were to be phased out and fresh fruit and vegetables and water were to become recommended. Pupils and schools were supported by the National Health Promoting Schools website and legislation that dictates how much salt, fat and sugar meals should contain. By 2006 all primary and secondary schools had a Health Promotion Strategy. However, a 2010 report by Cordia who regulates Glasgow's school canteens saw an increase in secondary pupils rejecting canteen meals and opting for fast food outlets. Glasgow saw 61% uptake in school meals in 2006 drop to 38% 4 years later.