1 / 18

Missouri Death Penalty Charges by Race of Defendant and Race of Victim, 1978-1996

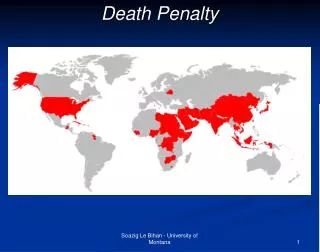
Missouri Death Penalty Charges by Race of Defendant and Race of Victim, 1978-1996. Crosstabs to Multivariate Regression. Research Question. What causes a capital defendant to get the death sentence?. Theory. Death sentence is caused by race of defendant

uriel-mann
Download Presentation

Missouri Death Penalty Charges by Race of Defendant and Race of Victim, 1978-1996

An Image/Link below is provided (as is) to download presentation Download Policy: Content on the Website is provided to you AS IS for your information and personal use and may not be sold / licensed / shared on other websites without getting consent from its author. Content is provided to you AS IS for your information and personal use only. Download presentation by click this link. While downloading, if for some reason you are not able to download a presentation, the publisher may have deleted the file from their server. During download, if you can't get a presentation, the file might be deleted by the publisher.

E N D

Presentation Transcript


  1. Missouri Death Penalty Charges by Race of Defendant and Race of Victim, 1978-1996 Crosstabs to Multivariate Regression

  2. Research Question • What causes a capital defendant to get the death sentence?

  3. Theory • Death sentence is caused by race of defendant • Death sentence is caused by race of victim

  4. Frequencies

  5. Death sentence Model + Race of Defendant + - Race of Victim

  6. Correlation syntax • corr death racedef racevic.

  7. Pearson r Correlation Table

  8. Death by Race of Defendant

  9. Regression syntax • regr vars = death racedef /depe = death/enter.

  10. Regression of Death Penalty on Race of Defendant

  11. Death By Victim Race

  12. Death By Victim Race

  13. Death by Defendant Race by Victim Race

  14. Previous Crosstab Simplifed:Percent Receiving Death Penalty

  15. Pearson r between Defendant Race and Death by Victim Race

  16. Histogram syntax • sort cases by racevic. • split file by racevic. • GRAPH /BAR(GROUPED)=PCT BY death BY racedef .

  17. Histograms White Victim Black Victim Race Defendant 100 100 White Black 80 80 60 60 40 40 20 20 0 0 Not death death Not death death death death

  18. Multivariate Death on Victim’s Race and Defendant’s Race

More Related