Download
1 / 22
270 likes | 592 Views
CHAPTER 5 RASTER DATA MODEL 5.1 Elements of the Raster Data Model 5.1.1 Cell Value 5.1.2 Cell Size Box 5.1 Rules in Determining a Categorical Cell Value 5.1.3 Raster Bands 5.1.4 Spatial Reference 5.2 Types of Raster Data 5.2.1 Satellite Imagery 5.2.2 USGS Digital Elevation Models (DEMs)

E N D
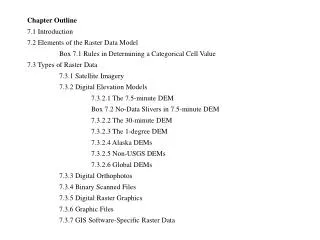
CHAPTER 5 RASTER DATA MODEL 5.1 Elements of the Raster Data Model 5.1.1 Cell Value 5.1.2 Cell Size Box 5.1 Rules in Determining a Categorical Cell Value 5.1.3 Raster Bands 5.1.4 Spatial Reference 5.2 Types of Raster Data 5.2.1 Satellite Imagery 5.2.2 USGS Digital Elevation Models (DEMs) Box 5.2 No-Data Slivers in 7.5-minute DEM 5.2.3 Non–USGS DEMs 5.2.4 Global DEMs 5.2.5 Digital Orthophotos 5.2.6 Bi-Level Scanned Files 5.2.7 Digital Raster Graphics (DRGs) 5.2.8 Graphic Files 5.2.9 GIS Software-Specific Raster Data
5.3 Raster Data Structure 5.3.1 Cell-by-Cell Encoding 5.3.2 Run Length Encoding 5.3.3 Quad Tree 5.3.4 Header File Box 5.3 A Header File Example 5.4 Data Compression Box 5.4 A Simple Wavelet Example: The Haar Wavelet 5.5 Data Conversion 5.6 Integration of Raster and Vector Data Box 5.5 Linking Vector Data with Images Key Concepts and Terms Review Questions Applications: Raster Data Model Task 1: View USGS DEM Data Task 2: View a Satellite Image in ArcMap Task 3: Convert Vector Data to Raster Data Challenge Question References
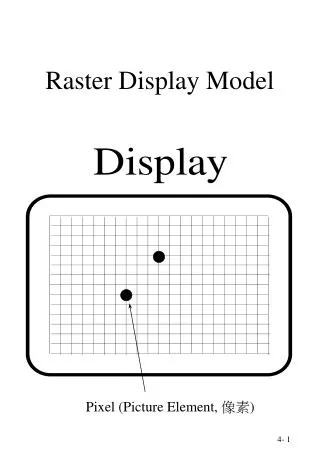
The Raster Data Model • A raster represents a continuous surface, but for data storage and analysis, a raster is divided into rows, columns, and cells. • Raster data represent points by single cells, lines by sequences of neighboring cells, and areas by collections of contiguous cells.
Figure 5.1 A continuous elevation raster with darker shades for higher elevations.
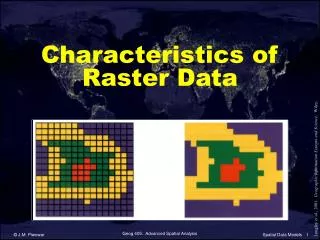
Figure 5.2 Representation of point, line, and area features: raster format on the left and vector format on the right.
Elements of the Raster Data Model • Cell value. Each cell in a raster carries a value, which represents the characteristic of a spatial phenomenon at the location denoted by its row and column. The cell value can be integeror floating-point. • Cell size. The cell size determines the resolution of the raster data model. • Raster bands. A raster may have a single band or multiple bands. • Spatial reference. Raster data must have the spatial reference information so that they can align spatially with other data sets in a GIS.
Figure 5.3 UTM coordinates for the extent and the center of a 30-meter cell.
Figure 5.4 DEMs at three resolutions: 30 meters, 10 meters, and 3 meters. The 30-m and 10-m DEMs are USGS DEMs. The 3-m DEM is a derived product from LIDAR data.
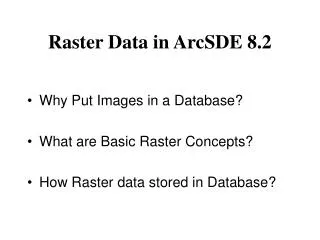
Types of Raster Data • Satellite Imagery • Digital Elevation Models (DEMs) • Digital Orthophotos (DOQ) • Bi-Level Scanned Files • Digital Raster Graphics (DRGs) • Graphic Files • GIS Software-Specific Raster Data
Figure 5.5 USGS 1-meter black-and-white DOQ for Sun Valley, Idaho.
Figure 5.6 A bi-level scanned file showing soil lines.
Figure 5.7 USGS DRG for Sun Valley, Idaho. This DRG is outdated compared to the DOQ in Figure 5.5.
Raster Data Structure • Cell-by-Cell Encoding • Run Length Encoding • Quad Tree
Figure 5.8 The cell-by-cell data structure records each cell value by row and column.
Figure 5.9 The run length encoding method records the cell values in runs. Row 1, for example, has two adjacent cells in columns 5 and 6 that are gray or have the value of 1. Row 1 is therefore encoded with one run, beginning in column 5 and ending in column 6. The same method is used to record other rows.
Figure 5.10 The regional quad tree method divides a raster into a hierarchy of quadrants. The division stops when a quadrant is made of cells of the same value (gray or white). A quadrant that cannot be subdivided is called a leaf node. In the diagram, the quadrants are indexed spatially: 0 for NW, 1 for SW, 2 for SE, and 3 for NE. Using the spatial indexing method and the hierarchical quad tree structure, the gray cells can be coded as 02, 032, and so on. See text for more explanation.
Data Compression • Data compressionrefers to the reduction of data volume. • A variety of techniques are available for image compression. Compression techniques can be lossless or lossy. • The wavelet transform, the latest technology for image compression, treats an image as a wave and progressively decomposes the wave into simpler wavelets.
Figure 5.11 The Haar wavelet and the wavelet transform. (a) Three Haar wavelets at three scales (resolutions). (b) A simple example of the wavelet transform.
Data Conversion The conversion of vector data to raster data is called rasterization, and the conversion of raster data to vector data is called vectorization.
Figure 5.12 On the left is an example of conversion from vector to raster data, or rasterization. On the right is an example of conversion from raster to vector data, or vectorization.
Landsat 7 http://landsat7.usgs.gov/ Terra / ASTER http://terra.nasa.gov/About/ AVHRR http://edc.usgs.gov/products/satellite/avhrr.html SPOT http://www.spot.com/ India’s space program http://www.isro.org/ Japan’s space program http://www.jaxa.jp/index_e.html Space Imaging http://www.spaceimaging.com/ QuickBird http://www.digitalglobe.com/ Intermap Technologies http://www.intermaptechnologies.com/
ETOPO5 http://edcwww.cr.usgs.gov/glis/hyper/guide/etopo5 GTOPO30 http://lpdaac.usgs.gov/gtopo30/gtopo30.asp GLOBE http://www.ngdc.noaa.gov/mgg/topo/globe.html LizardTech Inc. http://www.lizardtech.com/ ERDAS http://gis.leica-geosystems.com/ ER Mapper http://www.ermapper.com/ Feature Analyst http://www.featureanalyst.com USGS: status graphics for DEMs, DRGs, and DOQs http://statgraph.cr.usgs.gov/viewer.htm Geospatial One-stop http://www.geo-one-stop.gov/ Massachusetts GIS http://www.state.ma.us/mgis/mrsid.htm