Download
1 / 1
10 likes | 83 Views
The Structure of the Taurus Molecular Cloud Complex

E N D
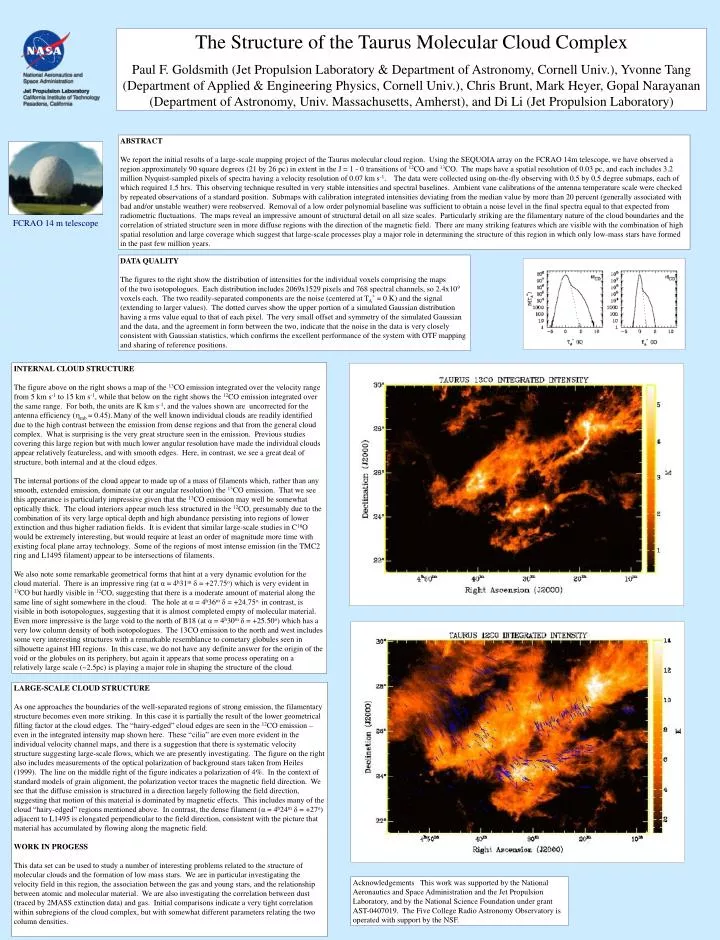
The Structure of the Taurus Molecular Cloud Complex Paul F. Goldsmith (Jet Propulsion Laboratory & Department of Astronomy, Cornell Univ.), Yvonne Tang (Department of Applied & Engineering Physics, Cornell Univ.), Chris Brunt, Mark Heyer, Gopal Narayanan (Department of Astronomy, Univ. Massachusetts, Amherst), and Di Li (Jet Propulsion Laboratory) ABSTRACT We report the initial results of a large-scale mapping project of the Taurus molecular cloud region. Using the SEQUOIA array on the FCRAO 14m telescope, we have observed a region approximately 90 square degrees (21 by 26 pc) in extent in the J = 1 - 0 transitions of 12CO and 13CO. The maps have a spatial resolution of 0.03 pc, and each includes 3.2 million Nyquist-sampled pixels of spectra having a velocity resolution of 0.07 km s-1. The data were collected using on-the-fly observing with 0.5 by 0.5 degree submaps, each of which required 1.5 hrs. This observing technique resulted in very stable intensities and spectral baselines. Ambient vane calibrations of the antenna temperature scale were checked by repeated observations of a standard position. Submaps with calibration integrated intensities deviating from the median value by more than 20 percent (generally associated with bad and/or unstable weather) were reobserved. Removal of a low order polynomial baseline was sufficient to obtain a noise level in the final spectra equal to that expected from radiometric fluctuations. The maps reveal an impressive amount of structural detail on all size scales. Particularly striking are the filamentary nature of the cloud boundaries and the correlation of striated structure seen in more diffuse regions with the direction of the magnetic field. There are many striking features which are visible with the combination of high spatial resolution and large coverage which suggest that large-scale processes play a major role in determining the structure of this region in which only low-mass stars have formed in the past few million years. FCRAO 14 m telescope DATA QUALITY The figures to the right show the distribution of intensities for the individual voxels comprising the maps of the two isotopologues. Each distribution includes 2069x1529 pixels and 768 spectral channels, so 2.4x10⁹ voxels each. The two readily-separated components are the noise (centered at TA* = 0 K) and the signal (extending to larger values). The dotted curves show the upper portion of a simulated Gaussian distribution having a rms value equal to that of each pixel. The very small offset and symmetry of the simulated Gaussian and the data, and the agreement in form between the two, indicate that the noise in the data is very closely consistent with Gaussian statistics, which confirms the excellent performance of the system with OTF mapping and sharing of reference positions. Dependence on t Larger total optical depth makes cloud colder throughout! Such effects are only prominent inside. INTERNAL CLOUD STRUCTURE The figure above on the right shows a map of the 13CO emission integrated over the velocity range from 5 km s-1 to 15 km s-1, while that below on the right shows the 12CO emission integrated over the same range. For both, the units are K km s-1, and the values shown are uncorrected for the antenna efficiency (mb = 0.45).Many of the well known individual clouds are readily identified due to the high contrast between the emission from dense regions and that from the general cloud complex. What is surprising is the very great structure seen in the emission. Previous studies covering this large region but with much lower angular resolution have made the individual clouds appear relatively featureless, and with smooth edges. Here, in contrast, we see a great deal of structure, both internal and at the cloud edges. The internal portions of the cloud appear to made up of a mass of filaments which, rather than any smooth, extended emission, dominate (at our angular resolution) the 13COemission. That we see this appearance is particularly impressive given that the 13CO emission may well be somewhat optically thick. The cloud interiors appear much less structured in the 12CO, presumably due to the combination of its very large optical depth and high abundance persisting into regions of lower extinction and thus higher radiation fields. It is evident that similar large-scale studies in C18O would be extremely interesting, but would require at least an order of magnitude more time with existing focal plane array technology. Some of the regions of most intense emission (in the TMC2 ring and L1495 filament) appear to be intersections of filaments. We also note some remarkable geometrical forms that hint at a very dynamic evolution for the cloud material. There is an impressive ring (at α = 4h31mδ = +27.75o) which is very evident in 13CO but hardly visible in 12CO, suggesting that there is a moderate amount of material along the same line of sight somewhere in the cloud. The hole at α = 4h36mδ = +24.75o, in contrast, is visible in both isotopologues, suggesting that it is almost completed empty of molecular material. Even more impressive is the large void to the north of B18 (at α = 4h30mδ = +25.50o) which has a very low column density of both isotopologues. The 13CO emission to the north and west includes some very interesting structures with a remarkable resemblance to cometary globules seen in silhouette against HII regions. In this case, we do not have any definite answer for the origin of the void or the globules on its periphery, but again it appears that some process operating on a relatively large scale (~2.5pc) is playing a major role in shaping the structure of the cloud. CO and CI LARGE-SCALE CLOUD STRUCTURE As one approaches the boundaries of the well-separated regions of strong emission, the filamentary structure becomes even more striking. In this case it is partially the result of the lower geometrical filling factor at the cloud edges. The “hairy-edged” cloud edges are seen in the 12CO emission – even in the integrated intensity map shown here. These “cilia” are even more evident in the individual velocity channel maps, and there is a suggestion that there is systematic velocity structure suggesting large-scale flows, which we are presently investigating. The figure on the right also includes measurements of the optical polarization of background stars taken from Heiles (1999). The line on the middle right of the figure indicates a polarization of 4%. In the context of standard models of grain alignment, the polarization vector traces the magnetic field direction. We see that the diffuse emission is structured in a direction largely following the field direction, suggesting that motion of this material is dominated by magnetic effects. This includes many of the cloud “hairy-edged” regions mentioned above. In contrast, the dense filament (α = 4h24mδ = +27o) adjacent to L1495 is elongated perpendicular to the field direction, consistent with the picture that material has accumulated by flowing along the magnetic field. WORK IN PROGESS This data set can be used to study a number of interesting problems related to the structure of molecular clouds and the formation of low mass stars. We are in particular investigating the velocity field in this region, the association between the gas and young stars, and the relationship between atomic and molecular material. We are also investigating the correlation between dust (traced by 2MASS extinction data) and gas. Initial comparisons indicate a very tight correlation within subregions of the cloud complex, but with somewhat different parameters relating the two column densities. This is a text box Subscript H2O α = 4h32m15s Acknowledgements This work was supported by the National Aeronautics and Space Administration and the Jet Propulsion Laboratory, and by the National Science Foundation under grant AST-0407019. The Five College Radio Astronomy Observatory is operated with support by the NSF.