Download

1 / 24
240 likes | 244 Views
This dataset includes monitoring data and in-lake modeling for total phosphorus, chlorophyll-a, and Secchi depth in Peltier and Centerville Lakes. The data covers the period from 1991 to 2006 for Peltier Lake and from 2000 to 2006 for Centerville Lake, during the growing season. The dataset also includes dissolved oxygen measurements and compares total phosphorus levels at the surface versus the bottom of the lakes. The modeling approach used is the Bathtub model, developed by the U.S. Army Corps of Engineers, which accounts for water and nutrient balance in a spatially segmented hydraulic network.

E N D
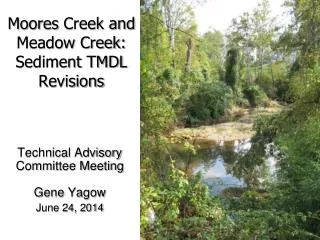
PELTIER LAKE TOTAL PHOSPHORUS MONITORING DATA, 2006 outlier removed
PELTIER LAKE 1991 – 2006, growing season
CENTERVILLE LAKE 2000 – 2006, growing season
IN-LAKE MODELING • Bathtub: Reservoir water quality model developed by the U.S. Army Corps of Engineers • Includes models for TP, chlorophyll-a, and Secchi transparency • Steady-state water and nutrient balance calculations in a spatially segmented hydraulic network; accounts for advective and diffusive transport and nutrient sedimentation
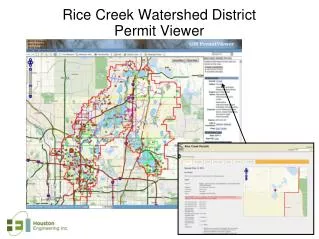
MODEL STRUCTURE Upper Rice Creek Clearwater Creek Hardwood Creek Internal Centerville direct drainage Direct precip Centerville Lake Direct precip Peltier direct drainage Peltier Lake Internal
MODEL SELECTION • Phosphorus: Canfield & Bachman, lakes (option 8) • Chlorophyll-a: P, light, T (option 2) • Secchi transparency: vs. Chl-a and turbidity (option 1)
MODEL CALIBRATION • Phosphorus calibration coefficient - adjusted from 1.0 to 0.6 for Peltier Lake • Chlorophyll-a calibration coefficient - adjusted from 1.0 to 1.5 for both Peltier and Centerville Lakes • Internal loading rate adjusted to further calibrate model
INTERNAL LOADING • Sediment data
PELTIER LAKE TP LOADS Watershed loads represent 48% of total load