Download
1 / 25
250 likes | 348 Views
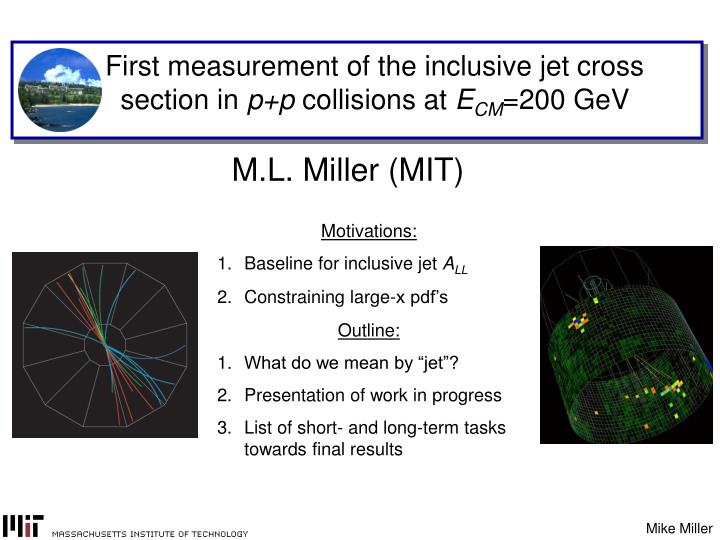
M.L. Miller (MIT). First measurement of the inclusive jet cross section in p+p collisions at E CM =200 GeV. Motivations: Baseline for inclusive jet A LL Constraining large-x pdf’s Outline: What do we mean by “jet”? Presentation of work in progress

E N D
M.L. Miller (MIT) First measurement of the inclusive jet cross section in p+p collisions at ECM=200 GeV • Motivations: • Baseline for inclusive jet ALL • Constraining large-x pdf’s • Outline: • What do we mean by “jet”? • Presentation of work in progress • List of short- and long-term tasks towards final results
What do we mean by “jet”? detector particle parton
What do we mean by “jet”? Data • midpoint-cone algorithm* • Search over “all” possible seeds for stable groupings • Check midpoints between jet-jet pairs for stable groupings • Split/merge jets based on Eoverlap • Add track/tower 4-momenta detector particle parton *(hep-ex/0005012)
What do we mean by “jet”? Data Simulation • midpoint-cone algorithm* • Search over “all” possible seeds for stable groupings • Check midpoints between jet-jet pairs for stable groupings • Split/merge jets based on Eoverlap • Add track/tower 4-momenta detector “geant” jets GEANT “pythia” jets particle pythia parton • Correction philosophy • Use Pythia+GEANT to quantify detector response • Estimate corrections to go from “detector” to the “particle” level *(hep-ex/0005012)
2004 p+p run Sampled luminosity: ~0.16 pb-1 1.4 M High tower (HT) events 0.8 M highly pre-scaled minimum bias (MB) events ~220k pT>5 GeV jets in HT sample before cuts Commissioned 1x1 jet patch trigger– main jet trigger in 2005+ 2004 p+p data set TPC 0<φ<2π 1< η<1 BEMC 0<φ<2π 0< η<1 in situ MIP+e calibration High Tower Trigger BBC coincidence + one tower above threshold (not the best jet trigger!) εTrig(η=0.0)=1: ET-tower= 2.5 GeV εTrig(η=0.8)=1: ET-tower= 3.3 GeV pT (track/tower) > 0.2 GeV |vertex-z|<60 cm rcone=0.4, fmerge=0.5 0.2< ηjet <0.8 ratio<0.9 (and ET-trig>3.5 GeV/c for HT)
2004 p+p run Sampled luminosity: ~0.16 pb-1 1.4 M High tower (HT) events 0.8 M highly pre-scaled minimum bias (MB) events ~220k pT>5 GeV jets in HT sample before cuts Commissioned 1x1 jet patch trigger– main jet trigger in 2005+ 2004 p+p data set TPC 0<φ<2π 1< η<1 BEMC 0<φ<2π 0< η<1 in situ MIP+e calibration High Tower Trigger BBC coincidence + one tower above threshold (not the best jet trigger!) εTrig(η=0.0)=1: ET-tower= 2.5 GeV εTrig(η=0.8)=1: ET-tower= 3.3 GeV pT (track/tower) > 0.2 GeV |vertex-z|<60 cm rcone=0.4, fmerge=0.5 0.2< ηjet <0.8 ratio<0.9 (and ET-trig>3.5 GeV/c for HT)
Background Removal Data pythia+geant Systematic uncertainty on yield from background less than ~5% Cut to remove background
Response & bin quality factors Simulation Simulation: ~25% ± 5% for 10<pT<50 GeV/c Consistent number derived from (modest) sample of di-jet events • Consider detector response (measured) to known input (true) “geant jets” “pythia jets”
Response & bin quality factors Simulation Simulation • Consider detector response (measured) to known input (true) “geant jets” “pythia jets”
Response & bin quality factors Simulation Simulation • Consider detector response (measured) to known input (true) “geant jets” “pythia jets” • Bins of width 1-sigma “purity” of ~35% over range on the diagonal. • Motivates application of bin-by-bin correction factors.
Uncorrected per-event yield Allows data/MC comparison before luminosity For HT, include trigger pre-scale: • Reasonable agreement between data/MC • 10 weighted pythia samples • Slope difference: • Short term: incorporated into sys. uncertainty • Long term: iterative re-weighting of MC sample
Bin-by-bin correction factors “measured” Simulation “true” εjet : decreases c(pT) resolution: increases c(pT) εTrig: ~1 e-2 at pT-jet = 5 GeV ~1 at pT-jet = 50 GeV • MB data statistics limited • More advanced unfolding techniques currently under study
Towards a “corrected” cross section ~60% Under study Fortran code from hep-ph/0404057 (Jager et al.) rcone=0.4 CTEQ 6.1 μF= μR=pT Agrees with EKS NLO to better than 1% ±30% but invisible on this scale MB/HT overlap for 3 bins • Only data-statistical errors shown • Systematics and ratios on next slides
Dominant systematic uncertainty estimates BBC Trigger Normalization Energy Scale * Under Study * Under Study Fractional Change in x-section Background Pythia slope Statistics of c(pt) * Under Study • Dominant uncertainty: 10% change in ECal ~40% change in yield • More under long term study (see last slide)
“Corrected” data vs. NLO calculation • 50% systematic uncertainty from E-scale shown • Agreement (within systematics) over 7 orders of magnitude
“Corrected” data vs. NLO calculation • Things that could change this curve: • Refined BEMC calibration (pi0 calibration) • Improved correction for lost (no vertex) events (MC embedded in abort-gap data) • Improved unfolding scheme • Issues that won’t go away for 2004: • HT trigger: fragmentation bias, slow turn on with pT-jet • Jet energy scale (need integrated luminosity for photon-jet!) • 50% systematic uncertainty from E-scale shown • Agreement (within systematics) over 7 orders of magnitude
Summary and outlook • Much work to develop methods and techniques for jet triggering, reconstruction, and analyses • First look: • Significant pT reach (~50 GeV/c) • Agreement within large systematics with NLO calculations • A few primary issues under study: • Refining in situ EMC calibrations (AuAu vs. CuCu vs. pp) • Overall scale corrections for no-vertex events • Improved unfolding methods • Fragmentation bias (e.g., Pythia vs. Herwig) • NLO clustering scheme • Goal: • Bring 2004 (and 2003) analyses to efficient closure • Large 2005 data set produced, thesis analyses underway • Long term cross section goals • Jet shapes, NLO comparisons • High stats possible improvement of large-x pdf’s
Jet Energy Scale Systematics * Included in Correction Factor
2004 BEMC Calibration • Relative gain: • tower-by-tower MIP response • ~250 +- 50 MeV/mip • Absolute gain: • Eta ring TPC-electrons • 2<pelectron<6 GeV/c Typical tower response to MIP candidate in 2004 AuAu All towers, ptrack > 1.8 GeV
Theory Systematics Changing the pdf Changing the scale
Data vs. MC Clear background for ratio>0.9 Data/MC agreement improves at higher pt
Data vs. MC Red pythia + gstar Black data All error bars statistical High tower trigger pt (jet) >10 GeV/c
Data vs. MC Red pythia + gstar Black data All error bars statistical High tower trigger pt (jet) >10 GeV/c