Download
1 / 33
330 likes | 458 Views
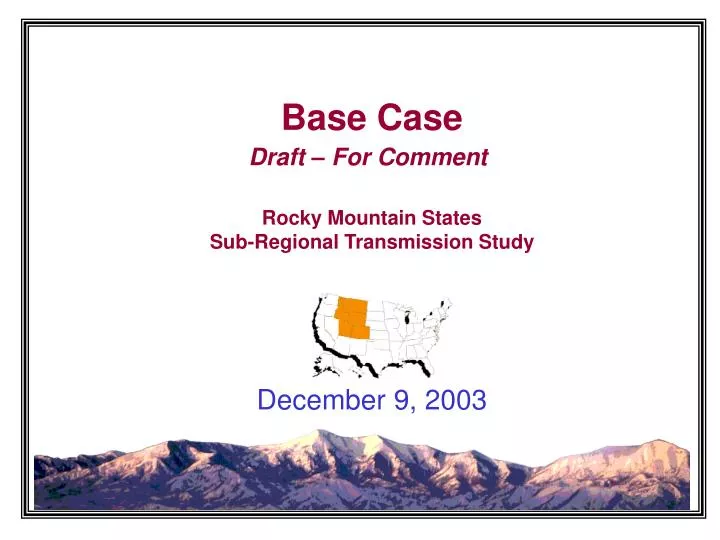
Base Case Draft – For Comment Rocky Mountain States Sub-Regional Transmission Study. December 9, 2003. Report Overview. Objectives Modeling approach and limitations Key assumptions Draft base case results. Base Case Objectives.

E N D
Base CaseDraft – For CommentRocky Mountain StatesSub-Regional Transmission Study December 9, 2003
Report Overview • Objectives • Modeling approach and limitations • Key assumptions • Draft base case results Draft - For Comment 2008 Base Case
Base Case Objectives • Focus on congestion issues that impact serving load in the RMATS sub-region • Assess the current system • Existing system, plus new, viable investment already in progress • Identify incidence and duration of congestion • Estimate the resulting congestion costs • Include several load, gas price, and hydro sensitivities • Review plant performance • Illuminate opportunities for cost-effective projects • Estimate the incremental value of expansion on congested paths • Identify potential modeling modifications Draft - For Comment 2008 Base Case
Modeling Approach • Modeled with ABB Market Simulator • Production cost model • West-wide scope with a particular focus on the RMATS region • Detailed transmission representation • Calculates nodal / bus prices • LP dispatch optimization is based on: • Variable O&M • Fuel cost • Transmission constraints • Impact of hydro and wind generation • Treated as a fixed dispatch to the system • After hydro and wind dispatch, the net load is passed to thermal dispatch • LMP differences are dampened as hydro is included • Single test year – 2008 • Existing system with incremental resources and transmission • All results presented in 2004 nominal dollars • Sensitivities to come (January): loads, gas prices, hydro conditions Draft - For Comment 2008 Base Case
Modeling Limitations • Modeling assumes a single, seamless west-wide market with no rate or loss pancaking, and no contractual impediments to trade • Not modeled: • Must-run generation • Unit commitment • Transmission wheeling and loss charges • Generator forced outages • Contractual / tariff constraints • Bid behavior Draft - For Comment 2008 Base Case
Base Case Assumptions Draft - For Comment 2008 Base Case
System “Balloon” Diagram Draft - For Comment 2008 Base Case
Loads by Western Interconnect Region- 2008Based on 2003 Load Forecast Annual GWh with Coincidental Summer & Winter Peaks (GW) Mexico - CFE NWPP-Canada Summer: 2.5 Winter: 2.3 Summer: 16.6 Winter: 20.3 14,425 California 130,743 Summer: 58.4 Winter: 57.0 309,324 NWPP-US 177,493 Summer: 25.9 Winter: 32.5 136,828 144,990 RMATS AZ, NM & S. NV Summer: 23.4 Winter: 20.3 Summer: 29.3 Winter: 26.5 Load: 913,803 GWh Summer Peak: 156 GW Draft - For Comment 2008 Base Case
Loads by RMATS Area - 2008 Based on 2003 Load Forecast Annual GWh with Non-Coincidental Summer & Winter Peaks (MW) Draft - For Comment 2008 Base Case
RMATS Resources Additions 2008 RMATS Resource Allocation Total Capacity 30,024 MW Draft - For Comment 2008 Base Case
Generation Capacity by Fuel Type (MW)- 2008 WI Total: 201,799 MW RMATS Total: 30,024 MW Draft - For Comment 2008 Base Case
Capacity Factors By Fuel Western Interconnect RMATS Draft - For Comment 2008 Base Case
Renewable Resources 2008 Wind Draft - For Comment 2008 Base Case
Hydro Generation Is Consistent with SSG-WI Sensitivity (January) Current Run Sensitivity (January) Draft - For Comment 2008 Base Case
Western Interconnect - Net Position Nameplate – Load (MW) Draft - For Comment 2008 Base Case
RMATS- Net Position Nameplate – Load (MW) Draft - For Comment 2008 Base Case
Gas Prices • Base case assumptions: • The 2008 US Average Wellhead will be set at $4.00 / MMBtu and at $5.00 / MMBtu for a sensitivity • The basis differential will be set to match the 5th Northwest Conservation & Electric Power Plan • Currently, 2008 Henry Hub Gas Future Price $4.70/MMBtu range (nominal $) Draft - For Comment 2008 Base Case
Typical Thermal Resource Values Are Used Per Generation Technology / Age Note: - KLG Judgement Peakers Cycling plants Aero-derivitives, Optimized for SC Larger Units, Optimized for CC Combined Cycles For peakers, it is assumed that the maintenance is deferred until a set number of hours is reached. Baseload plants are assumed to be staffed & running. Draft - For Comment 2008 Base Case
Maintenance Outages Values consistent with SSG-WI study (% year, very approximate) Combined Cycle 7% CT 7% Coal Plant 10% Steam Oil/Gas 10% Nuclear 12% Geothermal 10% Wind* 14%* *Built into provided spread sheet that was provided to modelers for hourly pattern. Most likely maintenance outages. Draft - For Comment 2008 Base Case
Draft Base Case Results • Determined location of expected loads and resources • “New” 2008 resources in RMATS are mostly gas-fired CCCTs in a region where the dominant capacity by fuel type is coal • Defined the boundaries of transmission usage and their associated costs • Area LMPs show transmission limitations and development opportunities. See chart on page 24. • Top 5 congested paths: • Idaho – Montana • IPP DC line • TOT 2C • Combined PACI and PDCI • Brownlee East • See charts on pages 27-31 Draft - For Comment 2008 Base Case
Draft Base Case Results (continued) • Clearing prices seen in certain RMATS areas signal the need for increased transmission to alleviate transmission congestion and levelize / stabilize the prices: (See table on page 26) • Lowest LMP for load average prices were at WAPA LC and Yellow Tail • Lowest LMP for generator average prices were at WAPA LC, IPP, Bonanza, Utah South, COw, BDVw, LRS Draft - For Comment 2008 Base Case
Idaho - Montana Duration Curve Draft - For Comment 2008 Base Case
IPP DC Duration Curve Draft - For Comment 2008 Base Case
TOT 2C Duration Curve Draft - For Comment 2008 Base Case
Combined PACI & PDCI Duration Curve Draft - For Comment 2008 Base Case
Brownlee Duration Curve Draft - For Comment 2008 Base Case
RMATS Interface Path Expansion Values • “Expansion values” represent the value of the next MW of additional transmission capacity • Calculated as: • The difference in marginal nodal / bus price at each end of the path • Over a 1-year period (2004$) • “Expansion values” represent the value of the next MW of additional transmission capacity • Calculated as: • The difference in marginal nodal / bus price at each end of the path • Over a 1-year period (2004$) Draft - For Comment 2008 Base Case
Base Case Next Steps • RMATS participants to provide comments on this draft • Obtain additional information on nomograms and new paths to monitor • Get final consensus on transmission additions • Finalize gas price assumptions • Clarify wind shaping assumptions • Run gas price, load and hydro sensitivities (January) • Finalize and present base case Draft - For Comment 2008 Base Case
2008 LMP Prices Clearing Prices $/MWH Draft - For Comment 2008 Base Case
Western Interconnect Expansion Values Yellow highlighting indicates RMATS interfaces All monetary amounts in nominal 2004 $ Draft - For Comment 2008 Base Case