Download
1 / 51
510 likes | 656 Views
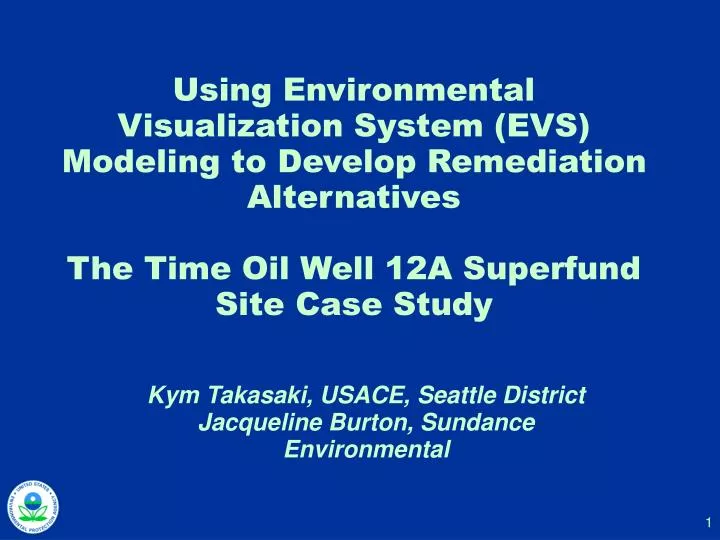
Kym Takasaki, USACE, Seattle District Jacqueline Burton, Sundance Environmental. Using Environmental Visualization System (EVS) Modeling to Develop Remediation Alternatives The Time Oil Well 12A Superfund Site Case Study. Presentation Topics.

E N D
Kym Takasaki, USACE, Seattle District Jacqueline Burton, Sundance Environmental Using Environmental Visualization System (EVS) Modeling to Develop Remediation AlternativesThe Time Oil Well 12A Superfund Site Case Study
Presentation Topics • General Description of Time Oil Well 12A Superfund Site, Tacoma, WA • Geostatistical 3-D data analysis/visualization to determine present site conditions (CSM) • Application of CSM to evaluate in place remedy
Site Background – Well 12A Superfund Site • Chlorinated organic solvents were detected in Well 12A above drinking water criteria in 1981 • Time Oil site identified as major source to groundwater contamination • Soil contamination from filter cake disposal/ site practices also present • Site located within the South Tacoma Ground Water Protection District
1983 ROD Remedial Action Objectives (RAOs) • Tiered cleanup goal alternatives in the ROD in order of increasing length of treatment time and cost: • Treat ground water at the source (the Time Oil property) meet requirements for storm sewer discharge • Treat the ground water at the source such that untreated Well 12A ground water could be used (after dilution with water from the rest of the well field) as drinking water • Treat the ground water at the source such that Well 12A ground water concentrations would satisfy the 1x10⁻⁶ risk level with no dilution • Treat the ground water such that all ground water within the property boundary satisfies the 1x10⁻⁶ risk level • Final goal to be based on treatment performance data after two years of implementation
Well 12A Site Status Summary • ROD amendments 1985, 1987 • Remedy implemented 1988 - today • Groundwater Extraction Treatment System (GETS): 550 million gallons of groundwater extracted/treated, removed 16,000 pounds VOCs - ongoing • Vapor Extraction System (VES): Removed 54,100 pounds VOCs • Filter cake/contaminated soil removal: Excavated 6,200 CY of filter cake • Five year reviews 1993, 1998, 2003, 2008
Triad Activities • Conducted Systematic Planning to: • Refine CSM • Identify uncertainties • Refine exit strategy toward site closure • Develop targeted remedial goals to help achieve goals • Will be using real-time analytical methods and dynamic work strategies, including performance based measurements during remedy implementation
Systematic Planning: Identifying Unresolved questions • Is the GETS containing the GW plume? • First two tiers of objectives met – can we meet the rest? • How long will we have to keeping treating? • What will happen if drinking well pump rate or duration is increased? • Will other drinking water wells become impacted? • Is there any direct contact risk from residual soil contamination?
CSM Needs to help Resolve Uncertainty • Data analysis to bring years of data together for a comprehensive integrated analysis of site • Identify and delineate specific areas that still need action to help achieve RAOs and identify related uncertainties • Screen and evaluate technologies to modify treatment • Based on technology selection, set interim goals for realistic achievement of site closure
CSM Prior to Geostatistical 3-D Data Analysis /Visualization
Reason for Using 3-D Geostatistical Data Analysis/Visualization at 12A • Bring all data together in one format for CSM development to document remedy performance and make informed decisions • At start, years of data in tables, differing mapping formats, differing scales from a variety of sources – can’t see the issues • 3- D Geostatistical Analysis Allows Us to Do this • Branch of statistics focusing on spatiotemporal datasets.
Location Map for Source (Time Oil) and Receptor (Tacoma Well 12A)
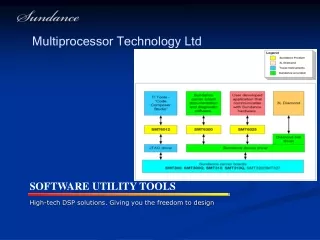
Data Are Entered from Excel or Databases – Example: Groundwater Data from one sampling period
Geology: Vadose and Saturated Zone Dominated by Higher Permeability Sands and Gravels – Silts and Clays Play Role in Contaminant Migration
Water Level Data used to Define Flow Directions, Gradients, and Delineation of Vadose Zone
3-D integration and analysis of contaminant and water level data showed TCE GW plume escaping GETS GETS Influence TCE Plume Escaping GETS
Integration of Soil, Groundwater Chemistry, and Water levels show Plume is sourced by Vadose/Saturated Zone Soil Contamination
Integration of Soil Contaminant Data and Geology Indicate Distribution of Soil Contamination at Vadose/Saturated Zone is Impacted by Silt Layers
Integration of Geology and Plume Data: Low Level TCE Plume Configuration Is Impacted by Silt Units in Saturated Zone
Refined Remedial Action ObjectivesFilter Cake and Soil • Filter Cake/Shallow Soil • Eliminate risk of direct contact with filter cake at and near the surface. (EPA addressing vapor intrusion under a separate activity after targeted soil and groundwater contamination is addressed) • Prevent or minimize the migration of contamination from highly contaminated shallow source areas into deeper vadose zone to prevent further degradation of deep soil and groundwater • Deep Vadose Zone Soil • Eliminate/minimize the mass of contaminants to reduce the mass flux from deep soils into groundwater
Refined Remedial Action Objectives: Groundwater • Source Area Saturated Soil and Groundwater Zone • Reduce mass flux by 90% from source area soils through a specific plane into the dissolved phase treatment zone. The proposed plane defined by current location of 300 ug/l isonconcentration. • Dissolved Phase Plume • Reduce contaminant concentrations so concentrations at the plume perimeter meet MCLs
CSM Refinements Built With 3-D Geostatistical Data Analysis/Visualization • Remedy in place not controlling migration of TCE plume nor cleaning soil contamination feeding plumes • Now know the position, dimensions, hosting units, mass, and volume of soil source term feeding the plume for evaluating remedy modification to eliminate the source • Use depictions to pinpoint key areas of uncertainty related to remedial decisions • Can continue to use system to create interim goals and revised RAOs to evaluate future remedies
Advantages Integrates all CSM data to same format Comprehensive picture of site for optimizing decision making Simple Images Backed by Large Understandable Databases with Confidence Calculations Limitations Results are only as good as data going in Success of approach is often operator dependent – must incorporate data quality and representativeness issues Geostatistical expertise required Advantages and Limitations of 3-D Analysis
EPA OSWER Technology Transfer Material Under Development • Memo: “Strategies for Contracting Geostatistical 3-D Data Analysis/Visualization Services in EPA Superfund Investigations” • Video: “Use of 3-D Geostatistical Data Analysis/Visualization in Superfund Remedial Investigations”
Acknowledgements • Kira Lynch, EPA Region 10 RPM, Well 12 A site • Steve Dyment, EPA HQ Office of Superfund Remediation and Technology Innovation Technology Integration and Information Branch • Aaron Fritz, CDM
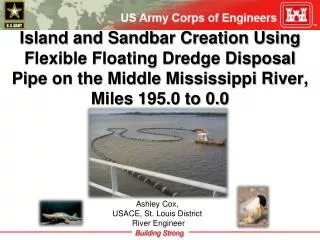
Omaha District Characterizing a Complex TCE Groundwater Plume Eliminating Source Areas, and Reducing Costs Shaw AFB, Sumter SC
Initial Process • Site identified when TCE (below MCLs) found in base drinking water well • Tier I Team weighed benefit of conventional versus Triad investigation approach
Conventional Approach • Draft, Draft Final and Final Work Plans, each followed by a comment and response process • Install wells near suspected sources and where contaminants were discovered • Remobilize for additional phases of investigation if needed • AOC-N could have required up to 80 wells to characterize the shallow and confined aquifers, a process that could have taken 3 years requiring multiple mobilizations to complete
Triad Approach • Triad Process • Strategic or Systematic Planning • Dynamic Work Strategies • Real Time Measurements/Decision Making
Triad Approach • Triad Team stakeholders included representatives from • SCDHEC • Air Force • USACE • Shaw E&I • Stone Environmental • Collaboration builds trust between stakeholders
AOC-N Triad Investigation • Systematic/Strategic Planning Meeting Feb 2006 • Dynamic Work Strategy Optimization • Conceptual Site Model identified six potential source areas across large and complex area • Identified initial sampling transects with clear decision rules for next sample locations • Draft to Final Approval; Triad Team approach allowed work plan to be developed and approved without multiple drafts
AOC-N Triad Investigation • Real Time Measurement/Decision Making • High quality data obtained within 24 to 48 hours • EDT allowed immediate incorporation into data base • Stakeholder access to active web portal and ArcVewer Map Site allowed timely review of data • Data interpretation by project geologist posted to the AOC-N Web Portal for review by all stakeholders prior to consultation calls • Reached consensus between all stakeholders on next sampling transects using dynamic work strategy established by the Triad Team
Conceptual Site Model • Complex Aquifer System • Shallow Groundwater in Duplin aquifer flows east • Deep Groundwater in Upper Black Creek confined aquifer flows west • Moderate to strong downward gradients • Aquifers are in communication east of the airfield • Sawdust Landing Formation separates aquifers in the area of the maintenance buildings
0 500 1000 Scale, feet 100 – 500 µg/L 50 – 100 µg/L 5 – 50 µg/L M W - 1 0 4 B A O C N D P T - 6 3 A O C N M W - 4 A O C N W P - 1 1 A O C N D P T - 7 A O C N D P T - 9 A O C N W P - 1 7 A O C N W P - 4 A O C N D P T - 6 A O C N M W - 6 A O C N D P T - 2 A O C N D P T - 4 2 5 0 M W - 1 0 9 B M W - 1 0 3 B A O C N D P T - 8 2 4 0 2 3 0 Duplin Fm 2 2 0 Sawdust Landing Fm 2 1 0 N D N D 2 0 0 1 J N D Elevation (Ft msl) 1 4 9 1 9 0 2 9 N D 1 8 0 N D 1 0 0 1 2 N D 1 7 0 1 1 0 2 0 7 1 6 0 87 3 3 8 1 J 6 5 2 1 4 1 5 1 5 0 2 1 4 0 5 1 3 4 1 7 2 N D 1 2 1 3 0 1 0 1 2 Upper Black Creek Aquifer 1 2 0 D N TCEConcentrations
M W - 1 0 2 B A O C N D P T - 1 5 A O C N D P T - 1 8 A O C N W P - 3 A O C N W P - 1 5 M W - 1 3 6 B ( o u t o f s e c t i o n ) M W - 1 3 4 B M W - 1 2 8 B / A O C N W P - 2 A O C N D P T - 2 0 A O C N D P T - 9 3 1 0 M W - 1 3 3 B M W - 1 2 4 B 3 0 0 A O C N D P T - 8 2 9 0 M W - 1 0 9 B 2 8 0 2 7 0 0 500 1000 L a n g S y n e F m . 2 6 0 2 5 0 2 4 0 Scale, feet 2 3 0 2 2 0 D u p l i n Elevation (Ft msl) 2 1 0 N D F m N D N D 2 0 0 S a w d u s t L a n d i n g F m N D 1 9 0 N D N D 1 8 0 N D 1 7 0 N D 2 9 1 6 3 1 6 0 1 J 7 3 4 1 0 6 7 1 5 0 9 8 3 4 1 3 4 6 1 0 9 1 1 4 0 4 9 3 0 N D 9 7 9 2 7 0 1 1 9 1 0 1 1 3 0 9 3 1 2 0 4 6 1 1 0 U p p e r B l a c k C r e e k A q u i f e r 4 5 100 – 500 µg/L 1 0 0 50 – 100 µg/L 5 – 50 µg/L TCE Concentrations
AOCNMW-05 0.44J AOCNMW-04 MW1610-19 149 ND MW1610-22 AOCNMW-06 MW1610-20 ND 2.35 ND MW1610-21 0.50J AOCNMW-03 ND MW1610-18 AOCNMW-01 ND 7.30 MW1610-24 MW1610-23 ND AOCNMW-02 ND ND Monitoring well location 100 – 500 µg/L Groundwater Flow Direction 50 – 100 µg/L 5 – 50 µg/L AOC-N TCE Plume, Shallow Groundwater September 2007 Shaw AFB, Sumter South Carolina TCE Plume Concentrations
Monitoring well location 100 – 500 µg/L Base well location 50 – 100 µg/L a Base wells are screened in the Lower Black Creek b Only Historical Data is available for this location 5 – 50 µg/L AOC-N TCE Plume, Upper Black Creek Aquifer September 2007 Shaw AFB, Sumter South Carolina MW-110B MW-135B 9.31 MW-139B MW-131B MW-126B ND ND 0.45J ND BW-5a MW-102Bb 1.8 MW-127B 19.7 MW-103B 169 13.7 MW-137B MW-104B MW-138B 1.09 207 0.501 MW-130B 97.6 MW-108B 0.795 MW-136B MW-134B MW-128B 106 BW-4a 6.77 69.6 6.2 MW-123B 2.37 MW-109B MW-132B 134 MW-124B MW-26Bb 8.09 MW-129B ND 119 MW-41B 7.79 MW-133B MW-125B 1.72 91.2 0.342 Groundwater Flow Direction TCE Plume Concentrations
Investigation Results • All six initially identified potential sources were eliminated • Plume geometries in shallow and confined aquifers reflect dominant groundwater flow patterns • Located previously unidentified contaminant source area in the north runway area • Confirmed the connection between the shallow and confined aquifer
Advantage of Profile Approach • Identified the target depth for the confined aquifer sampling zone • Revealed plume geometry and flow direction in both aquifer zones • Reduced the number of wells needed for an optimized LTM
Investigation Results • Source for the AOC-N plume is an undocumented release in the north runway area between the runway approaches • TCE plume in both aquifers adequately characterized by DPT data in the airfield to optimize monitoring well locations
Triad Team Decisions • Collaborative effort between all stakeholders streamlined the investigation and decision making process • Selected monitoring well locations for the shallow and confined aquifer in the north airfield area based on plume definition from DPT points • Installed monitoring wells into the confined aquifer west of the maintenance area based on projecting DPT data from within the plume core
RFI Findings • Existing monitoring wells adequately provide data for tracking plumes • AOC-N TCE plume concentrations in the confined aquifer decrease to below MCLs before reaching base boundary • AOC-N has been adequately characterized to finalize the RFI and begin the corrective measures study process
Benefits of the Triad Approach at AOC-N, Shaw AFB • Cost benefits • Realized cost savings by expediting work plan development and approval of approximately $40,000 • Realized cost savings for the field investigation by eliminating monitoring wells and mobilizations of approximately $81,000 • Optimized field investigation and decision making processes • Completed the AOC-N investigation in less than 1 year • Collaboration built trust between stakeholders