Download
1 / 48
480 likes | 610 Views
Climate and Biomes . Instructional PowerPoint to accompany Google Earth activity located at: http://serc.carleton.edu/eslabs/weather/4b.html. Teaching Instructions:

E N D
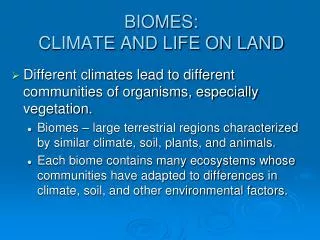
Climate and Biomes Instructional PowerPoint to accompany Google Earth activity located at: http://serc.carleton.edu/eslabs/weather/4b.html
Teaching Instructions: • This PowerPoint is designed to be used as a supplement to the Google Earth activity described on this page: http://serc.carleton.edu/eslabs/weather/4b.html • Pre-lab Preparation: • Print the PowerPoint 2 slides per page, preferably in color. If possible, laminate the cards for longevity. Prepare enough sets of cards for each of the lab teams. • Print the a copy of the Whittaker classification scheme diagram for each lab team. • Optional: Provide a world map or globe for each lab team. Calculators may also be helpful for calculating average annual precipitation and temperature. • Day of Activity: • Students read the information on the cards and then sort the cards into stacks matching them to the Whittaker classification scheme. • When teams are finished sorting the cards, share the PowerPoint with the class. Discuss their answers, and compare with the Biome Type information given in the PPT (notes). • Alternately, have the students fill in a chart with the following information: name of the city; average precipitation and temperature; and biome type. Collect and grade the charts.
Charlotte, North CarolinaElev: 228.9m Lat: 35° 14' N Long: 80° 50' W Image of Biome Climatograph
Acapulco, MexicoElev: 3 m Lat: 16 ° 50' N Long: 99 ° 56'W Image of biome Climatograph
Addis Ababa, EthiopiaElev: 2450m Lat: 09 ˚ 20' N Long:38 ˚ 45' E Image of biome Climatograph
Alice Springs, AustraliaElev: 6.1mLat: 23 ° 48' S Long:133 ° 53' E Image of biome Climatograph
Anchorage, AK (USA)Elev: 34.7 m Lat:61° 11'N Long:150° 00'W Image of biome Climatograph
Asheville, NC (USA)Elev: 652.3 m Lat: 35˚ 26'N Long:82˚ 32'W Image of biome Climatograph
Athens GreeceElev: 107 m Lat: 37 ° 58' N Long:23 ° 43' E Image of biome Climatograph
Atlanta, GA (USA)Elev: 307.8 m Lat: 33˚ 38'N Long:84˚ 26'W Image of biome Climatograph
Austin, TX (USA)Elev: 189.3 m Lat: 30° 18'N Long: 97˚ 42'W Image of biome Climatograph
Baltimore, Maryland, (USA)Elev: 45.1 m Lat: 39o 10'N Long: 76o 41'W Image of biome Climatograph
Bangkok , Thailand Elev: 16.2 m Lat: 13 ° 44' N Long: 100 ° 30' E Image of biome Climatograph
Baton Rouge, LA (USA)Elev: 19.5 m Lat: 30˚ 32'N Long: 91˚ 09'W Image of biome Climatograph
Belem, Brazil Elev: 12.8 m Lat: 01 ° 27' S Long: 48 ° 29'W Image of biome Climatograph
Bismark, ND (USA) Elev: 503.2 m Lat: 46˚ 47'N Long: 100˚ 45'W Image of biome Climatograph
Boston, MA (USA)Elev: 6.1 m Lat: 42˚ 22'N Long: 71˚ 01'W Image of biome Climatograph
Brownsville, TX (USA)Elev: 5.8 m Lat: 25˚ 54'N Long: 97˚ 26'W Image of biome Climatograph
Buffalo, New York (USA)Elev: 214.9 m Lat: 42o 56'N Long: 78o 44'W Image of biome Climatograph
Burlington, VT (USA)Elev: 100.6 m Lat: 44˚ 28'N Long: 73˚ 09'W Image of biome Climatograph
Cairo, EygptElev: 116.1 m Lat: 29 ˚ 52' N Long: 31 ˚ 20' E Image of biome Climatograph
Calgary, Alberta (Canada)Elev: 1079 m Lat: 51° 06' N Long: 114° 01'W Image of biome Climatograph
Caribou, ME (USA)Elev: 109.2 m Lat: 46° 52'N Long: 68° 02'W Image of biome Climatograph
Charleston, SC (USA)Elev: 12.2 m Lat: 32° 54'N Long:80˚ 02'W Image of biome Climatograph
Christchurch, New ZealandElev: 36 m Lat: 43 ° 29' S Long:172 ° 36' E Image of biome Climatograph
Dakar, SenegalElev: 39.9 m Lat: 14 ˚ 42' N Long: 17˚ 29' W Image of biome Climatograph
Darwin, AustraliaElev: 31.7 m Lat: 15˚ 25' S Long:130˚ 52' E Image of biome Climatograph
Denver, CO (USA)Elev: 1611.2 m Lat: 39° 46'N Long: 104˚ 52'W Image of biome Climatograph
Des Moines, IA (USA)Elev: 291.7 m Lat: 41˚ 32'N Long:93˚ 40'W Image of biome Climatograph
Fairbanks, AK (USA)Elev: 141.1 m Lat: 64˚ 49'N Long: 147˚ 51'W Image of biome Climatograph
Fresno, CA (USA)Elev: 101.5 m Lat: 36° 47'N Long: 119° 43'W Image of biome Climatograph
Green Bay, WI (USA)Elev: 209.7 m Lat: 44˚ 29'N Long: 88˚ 08'W Image of biome Climatograph
Hilo, HI (USA)Elev: 9.1 m Lat: 19˚ 43'N Long:155˚ 04'W Image of biome Climatograph
Jackson, MS (USA)Elev: 94.5 m Lat: 32° 19'N Long:90° 05'W Image of biome Climatograph
Lubbock, TX (USA)Elev: 991.8 m Lat: 33˚ 39'N Long:101˚ 49'W Image of biome Climatograph
Miami, FL (USA)Elev: 10.7 m Lat: 25˚ 49'N Long:80˚ 18'W Image of biome Climatograph
Moscow, ID (USA)Elev: 810.8 m Lat: 46˚ 43'N Long: 116˚ 58'W Image of biome Climatograph
Omsk, RussiaElev: 85 m Lat: 54˚ 58' N Long:73˚ 20' E Image of biome Climatograph
Phoenix, AZ (USA)Elev: 337.4 m Lat: 33° 26'N Long: 112˚ 00'W Image of biome Climatograph
Portland, OR (USA)Elev: 13.7 m Lat: 43° 39'N Long:70° 18'W Image of biome Climatograph
Reykjavik, IcelandElev: 28 m Lat: 64 ˚ 09' N Long:21 ˚ 56' W Image of biome Climatograph
Salt Lake City, UT (USA)Elev: 1287.8 m Lat: 40˚ 47'N Long: 111˚ 58'W Image of biome Climatograph
San Diego, CA (USA)Elev: 4.0 m Lat: 32˚ 44'N Long:117˚ 10'W Image of biome Climatograph
Santiago, ChileElev: 520 m Lat: 33˚ 27' S Long:70˚ 42'W Image of biome Climatograph
Saskatoon, CanadaElev: 515.1 m Lat: 52˚ 08' N Long:106˚ 38'W Image of biome Climatograph
Vancouver, BC (Canada)Elev: 38.7 m Lat: 49 ˚ 17' N Long: 123 ˚ 05'W Image of biome Climatograph