Download

1 / 30
300 likes | 442 Views
DEVELOPMENT OF PM2.5 FORECASTING TOOLS FOR THE MARAMA REGION. 2004 National Air Quality Conference Baltimore, MD 22-24 February 2004 Sharon Douglas ICF Consulting/SAI San Rafael, CA. OBJECTIVES. Explore relationships between PM2.5 (formation and transport) and meteorology

E N D
DEVELOPMENT OF PM2.5 FORECASTING TOOLS FORTHE MARAMA REGION 2004 National Air Quality Conference Baltimore, MD 22-24 February 2004 Sharon Douglas ICF Consulting/SAI San Rafael, CA
OBJECTIVES • Explore relationships between PM2.5 (formation and transport) and meteorology • Develop and evaluate data-based tools for use in forecasting PM2.5 • Nine areas of interest in the MARAMA region • Integrate historical, real-time, and forecast variables/parameters
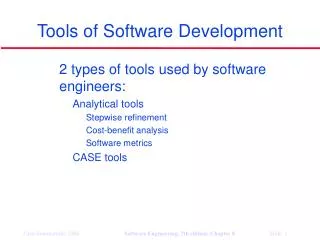
TECHNICAL APPROACH • Use Classification and Regression Tree (CART) analysis to • Classify days/periods for 1999 – 2002 according to PM2.5 concentration • Group days with similar PM2.5 values and meteorological characteristics • Determine key relationships and parameters that lead to different PM2.5 concentrations • Use CART results to develop PM2.5 forecasting algorithms
CLASSIFICATION AND REGRESSION TREE (CART) • Statistical tool used to separate and group days into classification “bins” • Bins are associated with a certain value or range of a classification or dependent variable (in this case, PM2.5 concentration) • Classification is based on the value of other independent (e.g., meteorological, PM indicator) parameters • Provides information about the conditions that are associated with different ranges of PM2.5 concentrations, as well as the frequency of occurrence of different types of conditions
SIMPLE CLASSIFICATION AND REGRESSION “TREE” EXAMPLE CART results take the form of an up-side-down classification “tree” - branches/ splits and independent variables (data) determine the binning N = 365 N = 200 N = 165 RH 65% RH> 65% WS 2 m/s WS > 2 m/s WD=N WD = E, S, W BIN #1 CLASS = 3 40.5 PM < 65.5 N = 50 BIN #2 CLASS = 1 PM < 15.5 N = 150 BIN #3 CLASS = 4 PM 65.5 N = 15 BIN #4 CLASS = 2 15.5 PM < 40.5 N = 150
MISCLASSIFICATION BY CART • Some misclassification of objects (days) expected due to • Incorrect assignment of the dependent variable to a classification category (e.g., determination of maximum PM2.5 for an area from a limited monitoring network) • Use of discrete classification categories • Complexity of inter-variable relationships • Completeness of the data wrt their ability to define the relationships • Data errors or missing data
CART APPLICATION FOR MARAMA PM2.5 FORECASTING • Separate CART analysis for each area of interest • Met variables only • Full input dataset • Data for 1999 – 2002, as available • Classification (dependent) variable is daily maximum PM2.5 • For the area of interest • Sites included in specifying the max defined by the state/local agencies
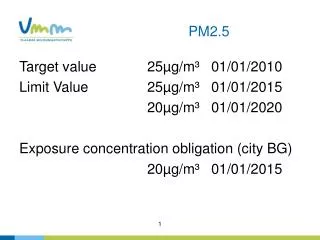
CART APPLICATION FOR MARAMA PM2.5 FORECASTING • Classification categories defined by EPA • Green: < 15.5 µg/m3 • Yellow: 15.5 to < 40.5 µg/m3 • Orange: 40.5 to < 65.5 µg/m3 • Red: >= 65.5 µg/m3 • Independent variables include both meteorological and PM2.5 variables; these were selected based on • Expected/known relationships • Availability (historical and for use in forecasting)
CART APPLICATION FOR MARAMA PM2.5 FORECASTING • Surface met data available for each area; upper-air meteorological parameters specified using the nearest or most geographically suitable NWS sounding • CART trees developed first using met data only; then PM2.5 information was added • Regional PM2.5 variables based on data availability; used nearby and potential upwind sites (with much experimentation)
INDEPENDENT VARIABLES • Surface meteorology (daily) • Minimum and maximum temperature • Average relative humidity • Average vector wind speed • Average wind direction • Number of 6-hourly periods with rainfall
INDEPENDENT VARIABLES (CONTINUED) • Upper-air meteorology (am and pm) • 900 mb to surface temperature difference (am) • 850 mb temperature (am) • 700 and 850 mb wind speed and direction (am, pm, and yesterday pm) • Change in 700 mb geopotential height (24 hour) • Cloud potential (am and pm) – based on RH at 850 and 700 mb relative to specified thresholds
INDEPENDENT VARIABLES (CONCLUDED) • PM2.5* (daily) • 2-days-ago PM2.5 value for area of interest (where available) • 2-days-ago PM2.5 value for one or more other areas (in some cases the maximum over multiple areas) * Used FRM data for the CART analysis; will use TEOM/continuous data for forecasting
MARAMA PM2.5 AREAS OF INTEREST Newark Philadelphia Wilmington Baltimore Washington DC Roanoke Richmond Bristol Charlotte
OVERVIEW OF CART ANALYSIS RESULTS FOR PM2.5: ALL AREAS • Approximately 80 to 90% of days are correctly classified • For each class, there are a number of bins (corresponding to different meteorological conditions) • Key “split” parameters vary among the areas and classification categories; relationships between the meteorological and PM2.5 parameters emerge
KEY FINDINGS FROM THE MARAMA CART APPLICATION • Adding 2-days-ago PM2.5 data • Generally improves classification accuracy • Changes (slightly) the relative importance of the meteorological parameters • For example, including PM2.5 variables for Richmond • Changes splits and variable importance slightly • Improves classification accuracy slightly overall (but in an important way for the Category 3 days)
CLASSIFICATION ACCURACY FOR MET ONLY & ALL VARS: RICHMOND CART Met Only Obs Met & PM Variables Obs
KEY FINDINGS FROM THE MARAMA CART APPLICATION • Categorical comparisons of the input parameters (by classification category) indicate • relationships between PM2.5 and the input parameters vary among the areas of interest • stability and wind parameters tend to vary across the categories • relative humidity does not vary much or in a straightforward way across the categories; has dual role in PM formation • PM2.5 concentrations tend to build up to the highest values
EXAMPLE CATEGORY SUMMARY TABLE FORBRISTOL Greater stability higher PM2.5 Little variation in RH Higher temps higher PM2.5 Little variation in wind direction aloft Lower wind speeds higher PM2.5 Higher PM in Knoxville higher PM2.5
CATEGORICAL COMPARISONS: BRISTOL • Higher PM2.5 values associated with • Higher temperatures (seasonal differences) • Lower wind speeds near the surface and aloft • More westerly surface wind components • Less precipitation and cloud cover • Greater stability • Less temporal variation in 700 mb height • Higher PM2.5 values in Knoxville 2-days-ago • Comparison of category means shows little variation in surface RH and wind direction aloft
KEY FINDINGS FROM THE MARAMA CART APPLICATION • In addition to the basis for the forecasting algorithm, the CART “splits” provide • information on the relative importance of the input parameters • conceptual descriptors for the various types of PM2.5 bins (events)
CART-BASED CONCEPTUAL DESCRIPTION FOR PM2.5: CHARLOTTE • Highest PM2.5 days are characterized by regional-scale build up of PM (based on 2-days-ago values) • Local meteorological factors such as low wind speeds, stability, and less cloud cover and precip characterize the higher PM2.5 days • Some tendency for winds from the E rather than the S also characterize the higher PM2.5 days
CART-BASED CONCEPTUAL DESCRIPTION FOR PM2.5: NEWARK • Highest PM2.5 days are characterized by regional-scale build up of PM (based on 2-days-ago values) • Local meteorological factors such as low wind speeds aloft and stability characterize the higher PM2.5 days • Some tendency for winds from the W rather than the SE also characterize the higher PM2.5 days
SUMMARY OF KEY FINDINGS FROM CART ANALYSIS • Different types of PM2.5 episodes can be identified based on met and aq indicators • Regional PM2.5 variables indicated to be more important for smaller/southern urban areas; local PM2.5 variables are more important for the larger/more northern areas • Stability parameters are important for all areas • Temperature tends to be used as a splitter early in the tree (segregating the days seasonally)
SUMMARY OF CART ANALYSIS RESULTS • RH is used to segregate the days but does not have a straightforward categorical tendency • Wind speed is important; lower wind speeds almost always lead to higher PM2.5 bins • Wind direction is often used as a split parameter, but does not always vary regularly among the categories • For all areas, less precipitation is associated with lower PM2.5 but is not frequently used by CART
OVERVIEW OF CART-BASED PM2.5 FORECASTING TOOL • CART classification trees are transformed into an interactive software tool such that any day with the required data can be assigned to a classification bin (based on the values of the data relative to the CART split parameters) • Forecasted meteorological variables are obtained from NWS and used together with 2-days-ago PM2.5 values to “classify” tomorrow within the CART bins • PM2.5 concentration range associated with the bin gives tomorrow’s PM2.5 forecast
EVALUATION OF CART-BASED PM2.5 FORECASTING TOOLS • Joint effort between SAI, MARAMA, and state and local forecasters • Evaluation using historical (actual) data • June, July, August 2003 • February, March 2004* • Evaluation using forecasted meteorological parameters and actual PM2.5 data • February, March 2004* • * Will support an assessment of the effects of met forecast accuracy
SOME KEY ELEMENTS OF MARAMA PM2.5 FORECASTING TOOLS • Forecasting tool includes a simple interface for entering data and displaying the results in tabular format; data can also be automatically input from files • In addition to concentration range (color), the tool provides • Uncertainty estimates based on classification accuracy for that bin • Alternate forecasts for more or less PM2.5 conducive met parameters (to account for possible forecast errors) • Average PM2.5 value for the bin