Download

1 / 7
70 likes | 211 Views
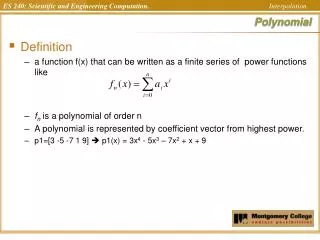
. We are going to use what we’ve learned about the graphs of polynomial and rational functions to solve polynomial and rational inequalities. POLYNOMIAL. AND. RATIONAL. INEQUALITIES. Consider the inequality:. Let’s look at the graph.

E N D
We are going to use what we’ve learned about the graphs of polynomial and rational functions to solve polynomial and rational inequalities. POLYNOMIAL AND RATIONAL INEQUALITIES
Consider the inequality: Let’s look at the graph It is a parabola with x intercepts (5, 0) and (-2, 0) and y intercept (0, -10). We could also find the vertex by FOILing and then using –b/2a but we will see that this will not be necessary to solve the inequality.
is still the problem we want to solve We have a graph of: Since the left hand side of the inequality is f(x), the inequality is asking, “Where is f(x) > 0”? Since the left hand side of the inequality is f(x), the inequality is asking, “Where is f(x) > 0”? (-,-2) or (5, ) Look at the graph to answer this question. f(x) is the y value so where is the function value or y value above the x axis?
Let’s try another one: First of all we want the right hand side to be zero so that when we look at the graph we are looking where the function is either above or below the x axis depending on the inequality. Factor Graph f(x) = left hand side, by finding intercepts Where is this graph less than or equal to 0? [-4, -3] Using interval notation: Using inequality notation:
Let’s try another one: The right hand side already is 0 so factor Factormore Graph f(x) = left hand side, by finding intercepts and using left & right hand behavior Where is this graph (the y value) greater than 0? (-3, 0) or (1, ) Using interval notation: Using inequality notation:
Let’s try a rational function: Graph f(x) = left hand side, by finding intercepts, asymptotes, other points etc. Where is this graph (the y value) greater than 0? (-, -1) or (3, ) Using interval notation: Using inequality notation:
Summary of Steps for Solving Polynomial or Rational Inequalities • Write the inequality so the polynomial or rational function is on the left hand side and the right hand side is zero. • If you have a rational function, get a common denominator if you don’t already have one. • Graph the function given on the left hand side of the inequality by methods learned previously in this chapter. • Look at the inequality to determine if you want function values above (greater than 0) or below (less than 0) the x-axis • State solution after looking at the graph. Make sure to include the endpoints if “or equal to” in the inequality (unless that would make a denominator 0). • Remember you are giving the x values where the y values make the inequality true.