Download
1 / 22
220 likes | 395 Views
Modeling impact of biomass burning on air quality in Southeast and East Asia. Kan Huang 1 , Joshua S. Fu 1,2 , N. Christina Hsu 3 , Yang Gao 1 , Xinyi Dong 1 , Si-Chee Tsay 3 , Yun Fat Lam 1

E N D
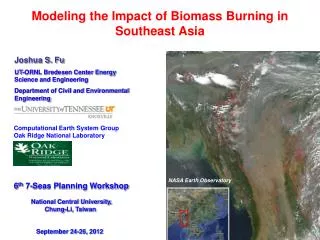
Modeling impact of biomass burning on air quality in Southeast and East Asia Kan Huang1, Joshua S. Fu1,2, N. Christina Hsu3, Yang Gao1, Xinyi Dong1, Si-Chee Tsay3, Yun Fat Lam1 1 Department of Civil and Environmental Engineering, The University of Tennessee, Knoxville, Tennessee, USA 2 UTK-ORNL Center for Interdisciplinary Research and Graduate Education, Knoxville, Tennessee, USA 3 Goddard Space Flight Center, NASA, Greenbelt, Maryland, USA 11th Annual CMAS Conference October 16, 2012
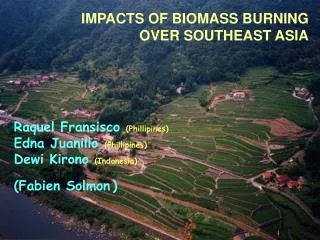
Biomass burning in Southeast Asia emits large amounts of trace gases and particulate matters into the atmosphere, and the long range transport of biomass burning could have significant impacts on East Asia. Observation in this area is rare, as well as model simulation. An quantitative impact assessment of biomass burning from Southeast Asia on the downstream regions is needed. There are large uncertainties in biomass burning emissions estimations, and which one is better? FLAMBE or GFEDv2.1? FLAMBE: The joint Navy, NASA, NOAA, and universities Fire Locating and Modeling of Burning Emissions http://www.nrlmry.navy.mil/aerosol web/arctas_flambe/data hourly/ GFEDv2.1: The Global Fire Emissions Database, Version 2.1 http://ess1.ess.uci.edu//~jranders/data/GFED2/ Motivations
WRF-CMAQ Regional Model (schematic framework) NCEP reanalysis data Land use Emission factors Biogenic Model (MEGAN) Biomass carbon emission (FLAMBE, GFED) Meteorology Model (WRF) Plume height Biogenic Emission Biomass emission mapping and vertical allocation Met-Chem Interface Processor (MCIP) + Anthropogenic emission (INTEX-B for Asia) Air Quality Model (CMAQ) Emission Data Model evaluation Model outputs: Gases and aerosol Ground and space measurement Impact assessment
Mapping Biomass Carbon to Species Emission Factor for Different Land Use types In order to map carbon emissions to other species (such as CO, CO2, PM2.5, etc., the following emission factors and land use (next slide) are used Source: Andreae and Merlet (2001)
Mapping Biomass Carbon to Species Land Use Type from WRF v3.1.1
Inject Height Distributions for Biomass Burning Emission Source: Air Sciences Inc. 2005. 2002 Fire Emission Inventory for the WRAP Region – Phase II. Draft Report. Prepared for the Fire Emissions Joint Forum of the Western Regional Air Partnership.
Modeling Domain (27*27km) and Observation Sites Five Southeast countries: Burma, Laos, Vietnam, Cambodia, and Thailand Available observation sites
Carbon Emission Comparison between FLAMBE and GFEDv2.1 Monthly carbon emission from FLAMBE and GFED Carbon emissions from FLAMBE is about 7-11 times higher than that from GFEDv2.1 in March and April, 2006 Study period : March to May, 2006
Evaluation of FLAMBE and GFEDv2.1 in CMAQ Hengchun Phimai CO is chosen as a tracer for evaluating the model performance by using FLAMBE and GFED as emission input, respectively. Phimai (Obs. data source: NASA) Hengchun (Obs. data source: Taiwan EPA) The model has better capability to capture the intensive biomass burning episodes using FLAMBE than using GFED. Possible reasons: 1. Time resolution: FLAMBE is hourly while GFED is monthly or weekly. 2. Different treatment of the fuel type Fu et al., 2012
Spatial Distribution of Biomass Carbon Emission Most intense biomass burning occurred in Burma, northern part of Thailand, Laos, and Vietnam.
Model Validation from Space-based Observation Huang et al., 2012 Relatively consistent spatial distribution as compared to the satellite observation Overestimation in Burma: possible overestimation of forest fires Underestimation in the south: possible underestimation of local anthropogenic emission
Regional Impact from Biomass Burning (Thailand) North Northeast Central South Model biased high about 2-5 folds in northern Thailand Biomass burning contributed ~ 20 – 40% of total CO in the other regions of Thailand. Huang et al., 2012 Ground CO data: Thailand Pollution Control Department
Aerosol Chemistry in SE Asia under Influence of BB Data source: EANET & Taiwan EPA Hanoi was most polluted in SE Asia from the observation. Model underestimated sulfate, nitrate and ammonium by a factor of 5–9, 3–10, and 1.5–2.5, respectively. • Possible reasons: • Local emission may be not good enough. • Heterogeneous reaction is not treated well in the model. Observation found a considerable amount of CaSO4 and Ca(NO3)2. Underestimation also occurred in downwind regions, e.g. southern Taiwan. While model performed well in northern Taiwan. Huang et al., 2012 Vietnam Thailand Philippines Taiwan
Taiwan as a watershed under Influence of BB Data source: Taiwan EPA Supersites Southern Taiwan Northern Taiwan No correlation between CO and OC in northern Taiwan probably indicated less impact from biomass burning, at least at the surface. The influence of biomass burning ends here and resulted in distinct characteristics of aerosol chemistry in northern and southern Taiwan Huang et al., 2012 Strong correlation between CO and OC in southern Taiwan and decreasing trends of OC/EC ratios from March to May.
Monthly Surface Impact of Zero Out Biomass Burning Emission Color contour: Base - Zero Out Case White Arrows: Horizontal Wind Red Contours(%): (Base - Zero Out Case)/Base In March, Southeast Asia biomass burning mainly affects southern part of East Asia, while in April, the impact could reach Yangtze River Delta region. Local impact of Southeast Asia biomass burning contributes about 30-60% to CO and PM2.5, and 10-20% to O3, while the transport impact could reach 20-40% to CO, 10-20% to O3 and 30-60% to PM2.5 in southern of East Asia. Fu et al., 2012
Long-range Transport of Biomass Burning Aerosol AOD AAOD SSA Model generally captured the episodes of column aerosol optical depth at multi-AERONENT sites. Vietnam Thailand Thailand Hong Kong The transport pathway from SE Asia to downwind regions is both illustrated from model and observation Taiwan Huang et al., 2012 Red dot: AERONET observation, Blue lines: model results
Episodic Vertical Impact from Biomass Burning Comparison to MPL Lidar at Phimai Surface to 1km: Local impact dominates 1-5km: Transport could be very fast due to strong horizontal west wind; Pollutants start to downwash after long range transport, which is an important factor on surface impact. The long range transport could contribute 70% to CO and 80% to PM2.5. 5km-14km: Not much impact in both local and transport cases Deposition around the Taiwan Straits The discrepancy may come from the injection height method of distributing the emission Fu et al., 2012
Nepal Llhasa Future Works Kampur EPA-NCU Hong Kong Hanoi SEAC4RS Aug-Sept 2012 Ground Network VASCO AERONET+ MPLNet HQ Bac Lieu Penang AERONET AERONET DRAGON Kuching Radiation Enhanced Site Singapore Supersite MPLNET Lidar Temporary MPLNET Lidar Jambi Non-NASA Lidars Jakarta MAN Hal Maring, 2012 VASCO
Current AERONET Sites and Potential 7SEAS sites Supersite Daughters of Divine Zeal? ? General Santos Airport? Kuching? Supersite Need a site. Current AERONET Supersite under development Proposed sites Neng-Hui Lin, 2012
Conclusions • FLAMBE biomass emissions are about 7-11 times higher than GFEDv2 in March and April 2006, and through the comparison in Phimai and Hengchun, FLAMBE shows better consistence with observational data. • Overall, CMAQ predicts similar spatial distributions as compared to various satellite sensors; Model comparison to various ground measurements suggested underestimation, which was attributed to the underestimated emission (local and/or biomass burning). The long-range transport pattern from the source region to downwind areas was well illustrated. • Monthly average impacts from biomass burning in Southeast Asia on East Asia could reach 4-6ppbv for O3, 40-120ppbv for CO, and 10-80 ug/m3 for PM2.5. Local impact of SA BB contributes about 30-60% to CO and PM2.5, and 10-20% to O3, while the transport impact could reach 20-40% to CO, 10-20% to O3 and 30-60% to PM2.5 in southern of East Asia. • Gases and aerosol had a strong upward transport from surface to high altitudes. The eastward transport becomes strong from 2 to 8 km in the free troposphere. The subsidence process during the long-range transport contributed 60 to 70%, 20 to 50%, and 80% on CO, O3 and PM2.5,respectively.
Acknowledgement We thank NASA GSFC on funding support (grant no.: NNX09AG75G). Data products from SMART-COMMIT and Deep Blue groups of NASA GSFC are funded by the NASA Radiation Sciences Program, managed by Dr. Hal Maring. We thank Dr. Edward J. Hyer for providing FLAMBE biomass burning emission data. We thank Thailand PCD, EANET, Taiwan EPA, Hong Kong EPD and AERONET for proving the measurement data. We would also like to thank Dr. Can Li from NASA for providing satellite products and observational data in Phimai, Dr. Carlo Wang for providing Lulin Mountain data and Dr. Hsin-Chih Lai for providing monitoring data in Taiwan. More info
Thanks for your attention! Questions ?