1 / 1

Online Fig . 1 Jian et al.

Serum iron ( m M ). TS (%). Online Figure S1. Body iron status in mice fed three different levels of iron diets. Serum iron and transferrin saturation (TS) rate in mice fed 3.5 ppm iron diet (iron deficient), 35 ppm and 350 ppm iron diets (normal low and normal high iron levels.

xuefang-jun
Download Presentation

Online Fig . 1 Jian et al.

An Image/Link below is provided (as is) to download presentation Download Policy: Content on the Website is provided to you AS IS for your information and personal use and may not be sold / licensed / shared on other websites without getting consent from its author. Content is provided to you AS IS for your information and personal use only. Download presentation by click this link. While downloading, if for some reason you are not able to download a presentation, the publisher may have deleted the file from their server. During download, if you can't get a presentation, the file might be deleted by the publisher.

E N D

Presentation Transcript


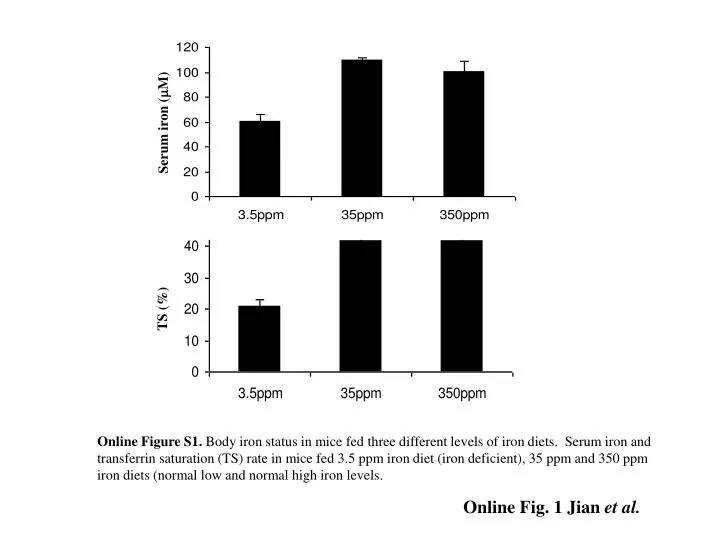
  1. Serum iron (mM) TS (%) Online Figure S1. Body iron status in mice fed three different levels of iron diets. Serum iron and transferrin saturation (TS) rate in mice fed 3.5 ppm iron diet (iron deficient), 35 ppm and 350 ppm iron diets (normal low and normal high iron levels. Online Fig. 1Jianet al.

More Related